TeXnicle is my favourite editor
for writing LaTeX documents. It is available for Max OS X.
So I’d like to use it when writing knitr‘s Rnw-files.
Rnw-files are LaTeX-files with embedded R-code in it. So Rnw-files need to be
preprocessed. The result is a tex-file which will be compiled by pdflatex or xelatex.
Processing is done by so called engines. TeXnicle comes with a bunch of different
engines. You can see them in preferences (hit ⌘-,) on tab “Typesetting”.
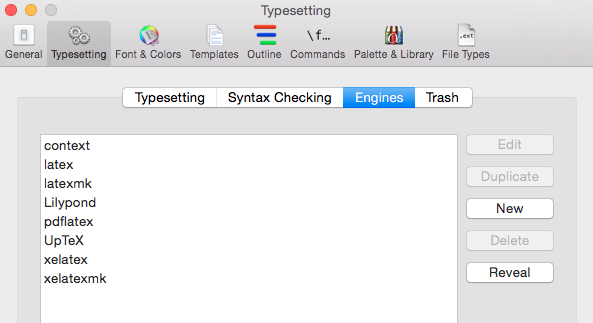
A new Enginge
So we need to create a new engine which does knitr’s preprocessing.
Just copy an existing one.
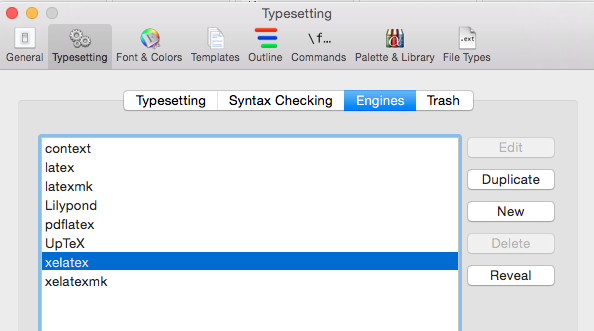
The engines are stored in
1
|
~/Library/Application Support/TeXnicle/engines
|
Use your favourite text-editor and add these lines:
 1
 2
 3
 4
 5
 6
 7
 8
 9
10
|
# sometimes the extension is missing ...
mainfile=${mainfile%%.Rnw}.Rnw

# Running knitr
export LANG=de_DE.UTF-8
/usr/bin/Rscript -e 'library(knitr); knit(\'${mainfile}\')'


mainfileTeX=${mainfile%%.Rnw}.tex
export TEXINPUTS=$TEXINPUTS:/Library/Frameworks/R.framework/Versions/Current/Resources/share/texmf/tex/latex/
|
between these lines here:
 1
 2
 3
 4
 5
 6
 7
 8
 9
10
|
# Go to the working directory
cd '$projectDir'
############################
# Insert new lines here    #
############################

echo ' '
echo '***------------------------------------------------------------'
echo '*** Run $runNumber of $nCompile...'
echo '***------------------------------------------------------------'
|
Also change the following line from
1
|
$ENGINE -synctex=1 -file-line-error --output-directory='$outputDir' -interaction=nonstopmode '$mainfile'
|
to
1
|
$ENGINE -synctex=1 -file-line-error --output-directory='$outputDir' -interaction=nonstopmode '$mainfileTeX'
|
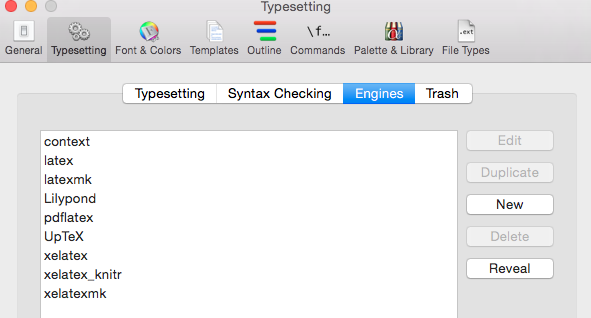
Save this new engine as xelatex_knitr.engine. Now you should see it in preferences after a restart of TeXnicle:
Using the new Engine
Now you can create a new TeXnicle-project.
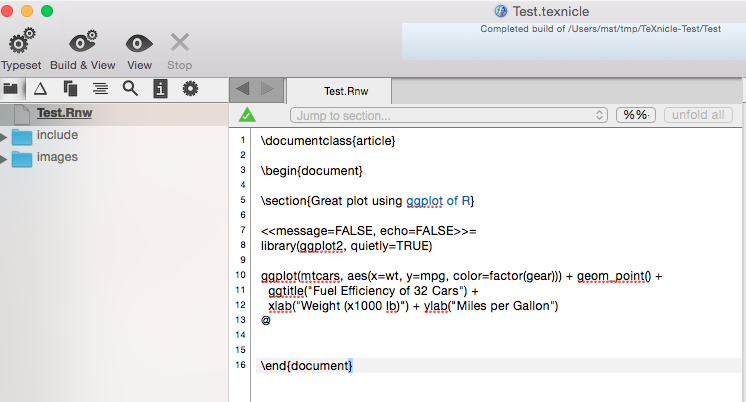
Create a new file in it and use the extension .Rnw.
 1
 2
 3
 4
 5
 6
 7
 8
 9
10
11
12
13
14
15
16
|
\documentclass{article}

\begin{document}

\section{Great plot using ggplot of R}

<<message=FALSE, echo=FALSE>>=
library(ggplot2, quietly=TRUE)

ggplot(mtcars, aes(x=wt, y=mpg, color=factor(gear))) + geom_point() +
  ggtitle('Fuel Efficiency of 32 Cars') +
  xlab('Weight (x1000 lb)') + ylab('Miles per Gallon')
@


\end{document}
|
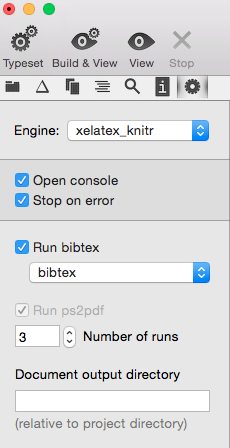
Last but not least you must choose the new engine for this project:
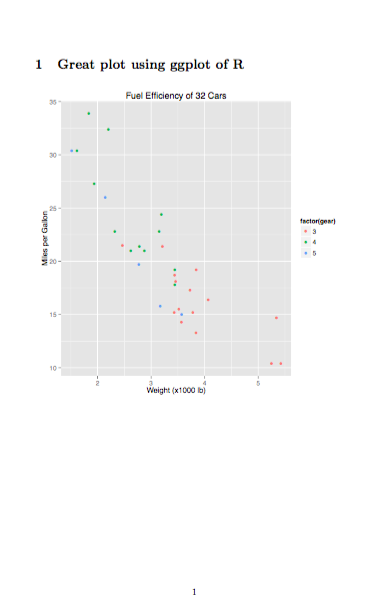
Hitting ⌘-r processes the Rnw-file and generates (hopefully) a pdf-file:
