ggplot2: x-axis scale now available on all facet-columns
One of the most annoying features of ggplot2 was the missing x-axis scale on facet-plots with some shorter columns.
To illustrate the problem see the following (pre-2.2-version) example:
|
|
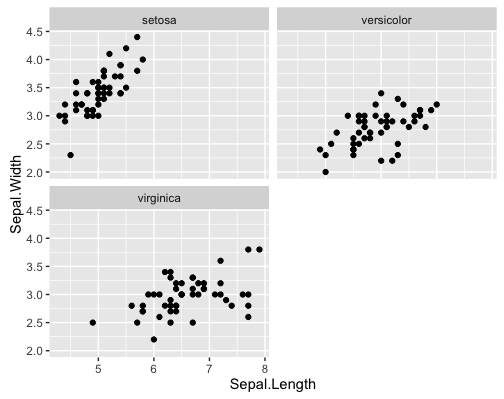
As you can see the scale of the x-axis under the second, shorte column is missing.
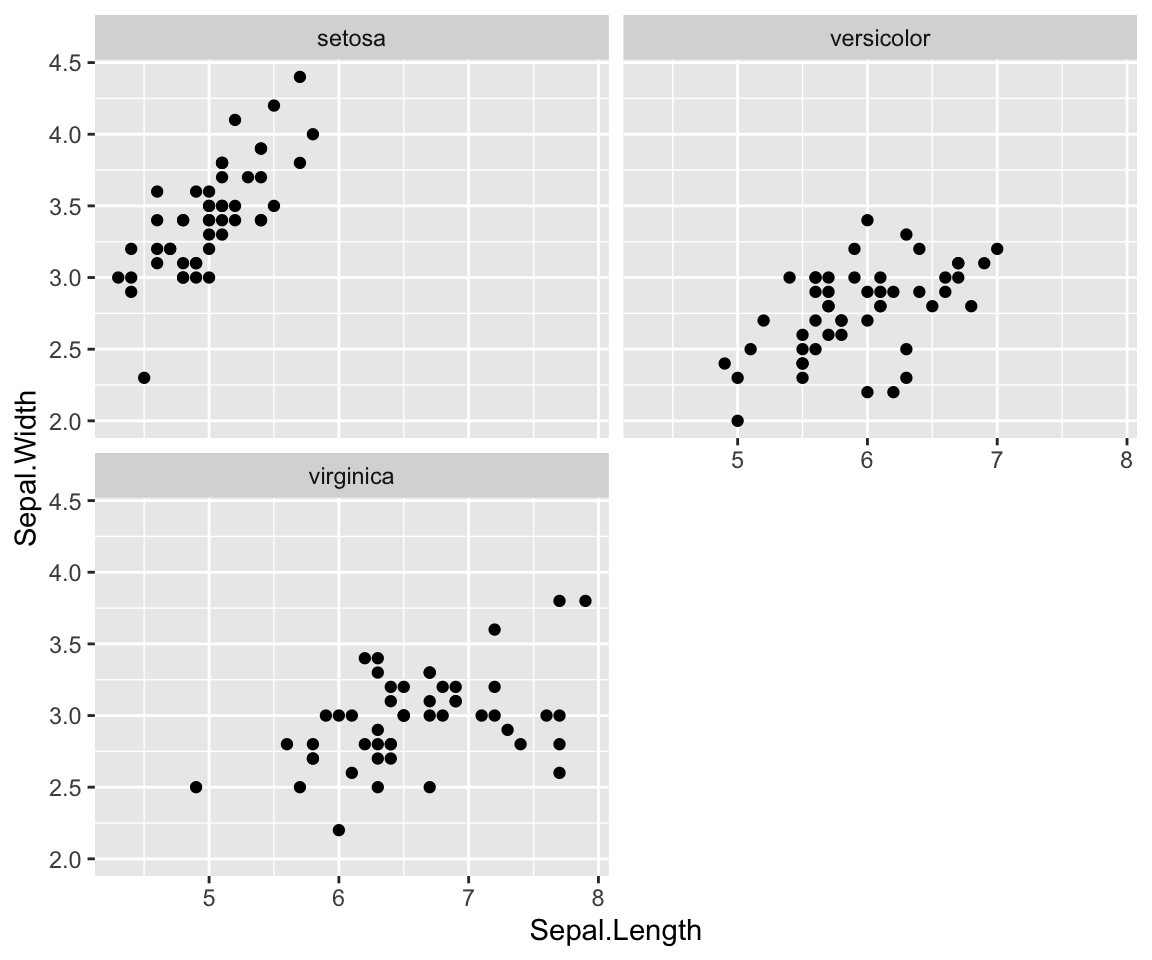
But with version 2.2.0 of ggplot2 this problem is solved:
If you ask how to install an older version of a package:
|
|