As time has gone by using custom fonts in ggplot2 graphics and LaTeX Documents is
still challenging but easier than years ago.
The One with the Data
So let’s start with some data:
1
2
3
4
5
6
7
|
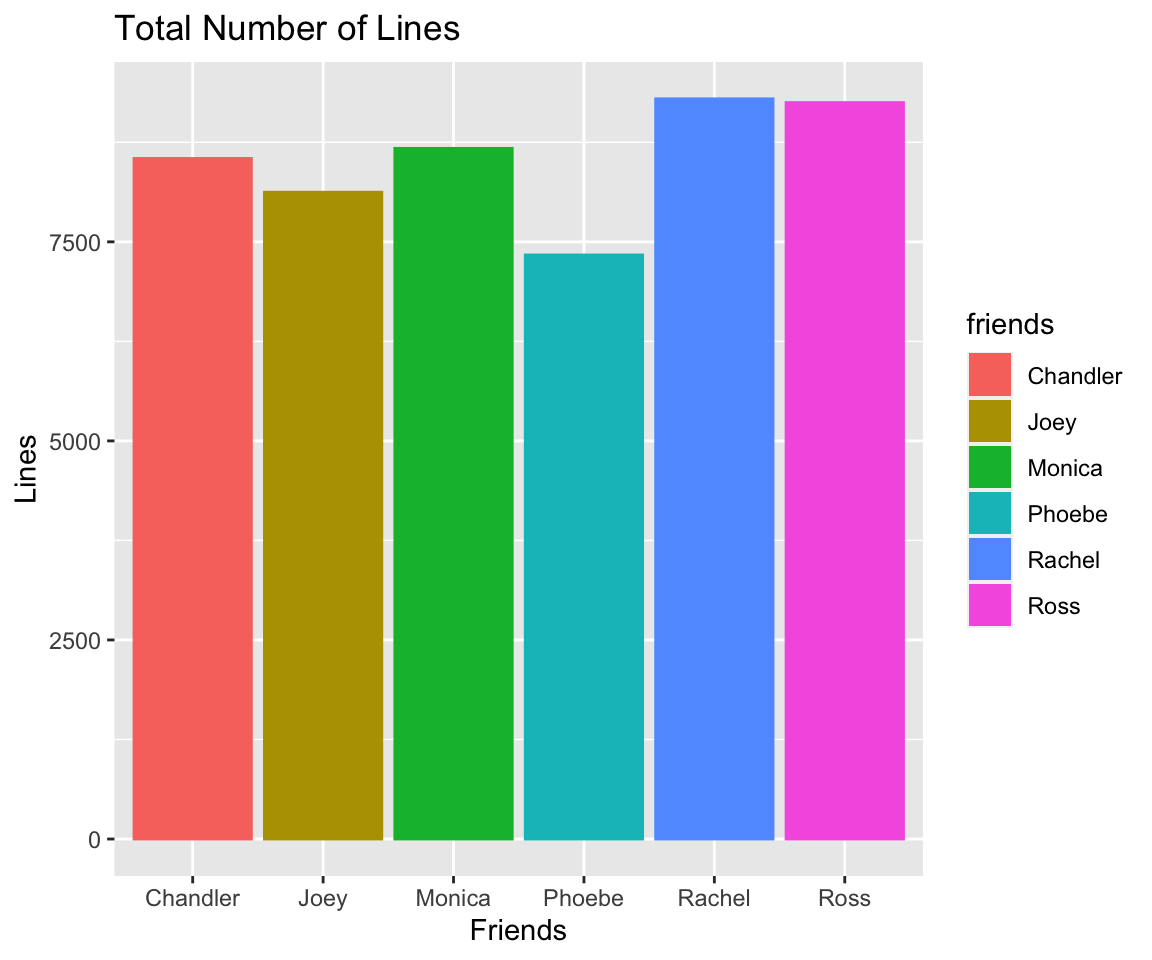
##    friends lines scenes  words
## 1     Ross  9249   1433 100282
## 2 Chandler  8547   1514  90067
## 3   Monica  8674   1439  85934
## 4     Joey  8123   1463  88087
## 5   Rachel  9296   1467  99801
## 6   Phoebe  7335   1318  80295
|
and plot the data
1
2
3
4
5
6
7
|
g <- ggplot(friendsData) +
  geom_bar(stat = "identity",
           aes(x=friends, y=lines, fill=friends, color=friends)) +
  xlab("Friends") + ylab("Lines") +
  guides(color=FALSE) +
  ggtitle("Total Number of Lines")
g
|
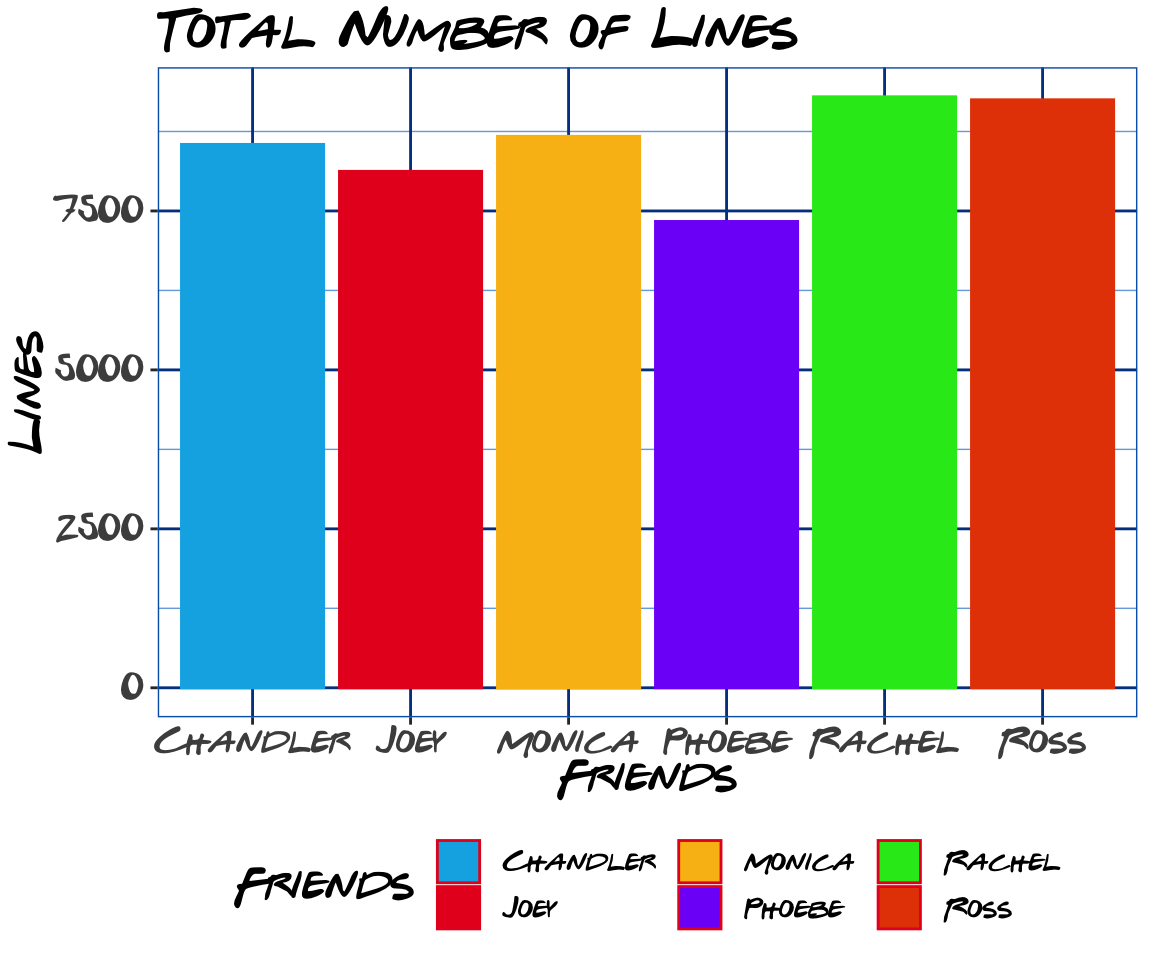
The One with the Fonts
Wouldn’t it be nice if we can use the friends font for this visualization? The font is free to use for personal and non-commercial use.
So first we need to install this font on OS-level. Mac users use the font-tool.
On Linux you can copy the font to ~/fonts in your home directory.
Importing the font to R
Before we can use the font in R we have to import it once:
1
|
## Registering fonts with R
|
1
2
3
|
loadfonts(device = "postscript")
# run the following command once
# font_import()
|
Defining a theme
Now we define a ggplot2-theme with the imported font and some adjustments for
the right colors.
 1
 2
 3
 4
 5
 6
 7
 8
 9
10
11
12
13
14
15
16
17
18
|
# friends Theme
friends.theme <- theme_bw() +
  theme(panel.border = element_rect(colour="#0062B9"),
        panel.background = element_rect(fill="white"),
        panel.grid.major = element_line(colour="#004290"),
        panel.grid.minor = element_line(colour="#77ABE0"),
        strip.background = element_rect(colour="#0062B9", fill="#0062B9"),
        strip.text       = element_text(colour="white"),
        text=element_text(size=16, family="Gabriel Weiss' Friends Font"),
        legend.text = element_text(size=10, face="bold"),
        legend.position="bottom"
  )

friends.colors <- c("#02B1e6", "#E81D22", "#F9BC15", "#8015f9", "#20e81d", "#e64602")
theme.colors <- c(friends.colors, friends.colors)
update_geom_defaults("bar", list(fill = "#02B1e6", colour="#E81D22"))

theme_set(friends.theme)
|
 1
 2
 3
 4
 5
 6
 7
 8
 9
10
|
g <- ggplot(friendsData) +
  geom_bar(stat = "identity",
           aes(x=friends, y=lines, fill=friends, color=friends)) +
  scale_color_manual(values = theme.colors) +
  scale_fill_manual(name="Friends", values = theme.colors) +
  xlab("Friends") + ylab("Lines") +
  guides(color=FALSE) +
  ggtitle("Total Number of Lines")

g
|
This article is the result of a talk I held at Campus useR Group Frankfurt.