How to detect the unexpected? Is the behaviour of some measured value normal or did
something unexpected happen?
To answer these questions we need to detect anomalous behaviour in a time series.
In this article I want to show you how we can do this with prophet.
Prophet is a library written by Facebook in python and R for prediction of time series.
So for anomaly detection we train our model according to the known values except
the last n. Then we predict the last n values and compare the predictions with
the truth. If they differ we call them an anomaly.
Here’s an example with some data of website usage.
The data
First let’s have a look at the data.
1
2
3
4
5
6
7
|
options(tidyverse.quiet = TRUE)
set.seed(123)
library(tidyverse)
library(lubridate)
library(prophet)

data <- read_csv2(file = "data.csv")
|
The data consists of weekly data of the sessions of a website. The date is the Monday
of the following week.
 1
 2
 3
 4
 5
 6
 7
 8
 9
10
11
12
13
14
|
## # A tibble: 226 x 2
##    date       sessions
##    <date>        <dbl>
##  1 2016-08-29    33789
##  2 2016-09-05    96677
##  3 2016-09-12    66682
##  4 2016-09-19    71878
##  5 2016-09-26    64230
##  6 2016-10-03    56080
##  7 2016-10-10    60685
##  8 2016-10-17    59456
##  9 2016-10-24    58737
## 10 2016-10-31    54871
## # … with 216 more rows
|
1
2
|
ggplot(data, aes(date, sessions)) +
  geom_point()
|
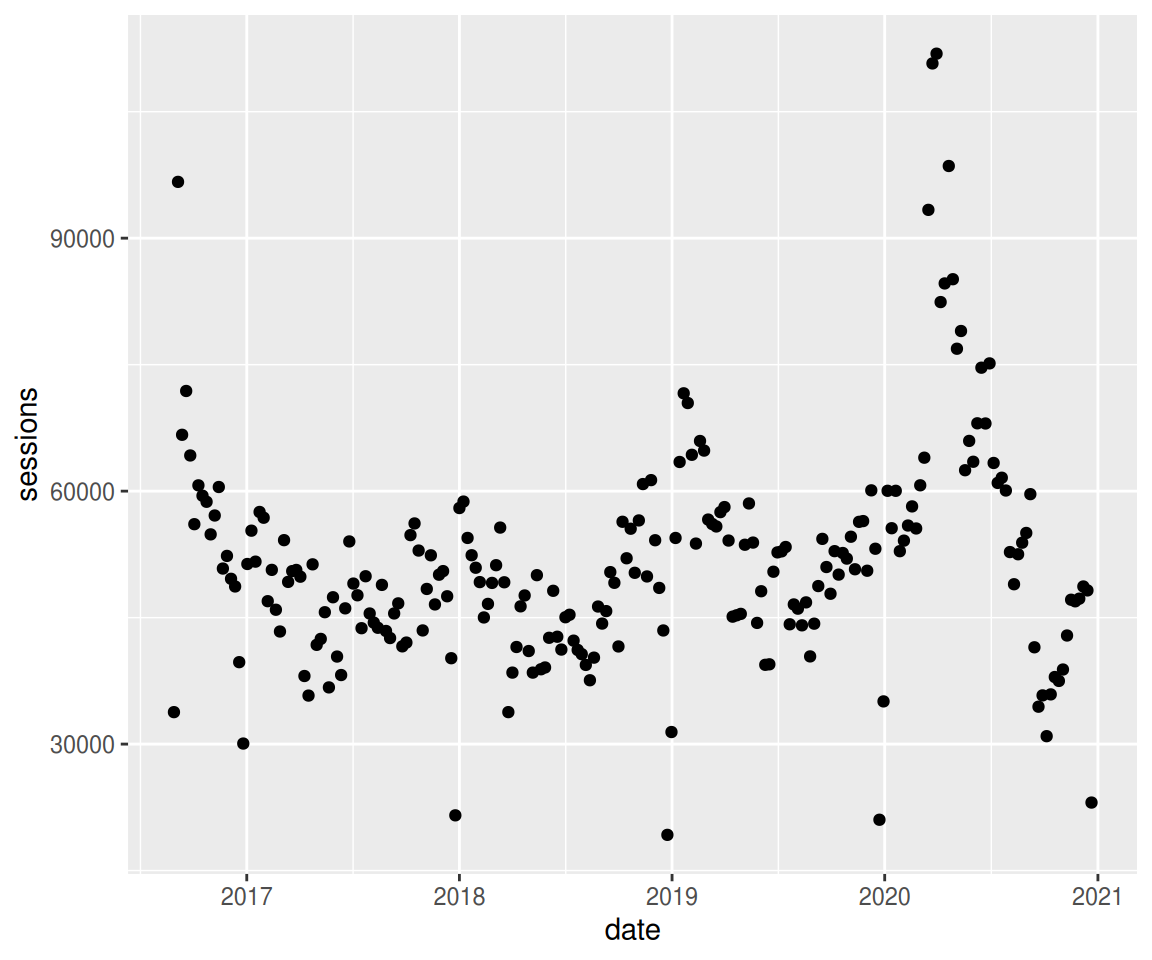
You can see clearly the drop in website usage at the end of the year.
During the summer there’s also less usage. This spring there’s an all time high.
(Guess Covid-19 started to spread then.)
Predictions with Prophet
Prophet predicts time series data. We want to predict number_of_weeks and compare
the prediction with the true values.
So we have to compute the last date (end_date) we can use for training.
1
2
3
|
number_of_weeks <- 4
horizon <- number_of_weeks * 7
end_date <- Sys.Date() - as.integer(format(Sys.Date(), format="%u")) - days(horizon)
|
Preparation
Prophet expects a data.frame with a column named ds containing the date and
a column y containing the depending data value. So let’s transform our data:
 1
 2
 3
 4
 5
 6
 7
 8
 9
10
|
df <- data %>%
  rename(
    ds = date,
    y = sessions
  ) %>%
  filter(
    ds <= end_date
  )

df
|
 1
 2
 3
 4
 5
 6
 7
 8
 9
10
11
12
13
14
|
## # A tibble: 222 x 2
##    ds             y
##    <date>     <dbl>
##  1 2016-08-29 33789
##  2 2016-09-05 96677
##  3 2016-09-12 66682
##  4 2016-09-19 71878
##  5 2016-09-26 64230
##  6 2016-10-03 56080
##  7 2016-10-10 60685
##  8 2016-10-17 59456
##  9 2016-10-24 58737
## 10 2016-10-31 54871
## # … with 212 more rows
|
Training and Prediction
So let’s train our model.
1
|
m <- prophet(df, yearly.seasonality = TRUE)
|
1
|
## Disabling weekly seasonality. Run prophet with weekly.seasonality=TRUE to override this.
|
1
|
## Disabling daily seasonality. Run prophet with daily.seasonality=TRUE to override this.
|
Now that our model is fitted let’s use it to do some predictions.
First we need to generate a data.frame containing the dates we want to predict.
Prophet provides a handy function make_future_dataframe.
We also only want to predict Mondays because our training data only consists of
Mondays.
1
2
3
|
future <- make_future_dataframe(m, periods = horizon)
future <- future %>%
  filter(wday(ds) == 2) # only mondays
|
The predict function returns the predictions for each row.
1
2
3
4
|
forecast <- predict(m, future) %>%
  mutate(ds = as.Date(ds))

tail(forecast[c("ds", "yhat", "yhat_lower", "yhat_upper")])
|
1
2
3
4
5
6
7
|
##             ds     yhat yhat_lower yhat_upper
## 221 2020-11-16 57873.97   44612.15   72174.34
## 222 2020-11-23 62491.01   48853.55   76087.17
## 223 2020-11-30 64055.74   51188.19   77232.26
## 224 2020-12-07 58913.81   44298.35   72092.63
## 225 2020-12-14 49692.85   35710.07   64220.86
## 226 2020-12-21 43711.61   29925.02   57095.17
|
The result forecast contains the forecast (yhat) and an uncertainty interval
(yhat_upper and yhat_lower).
Visualization
Prophet provides a simple visualization of the prediction and the uncertainty
interval: plot(m, forecast)
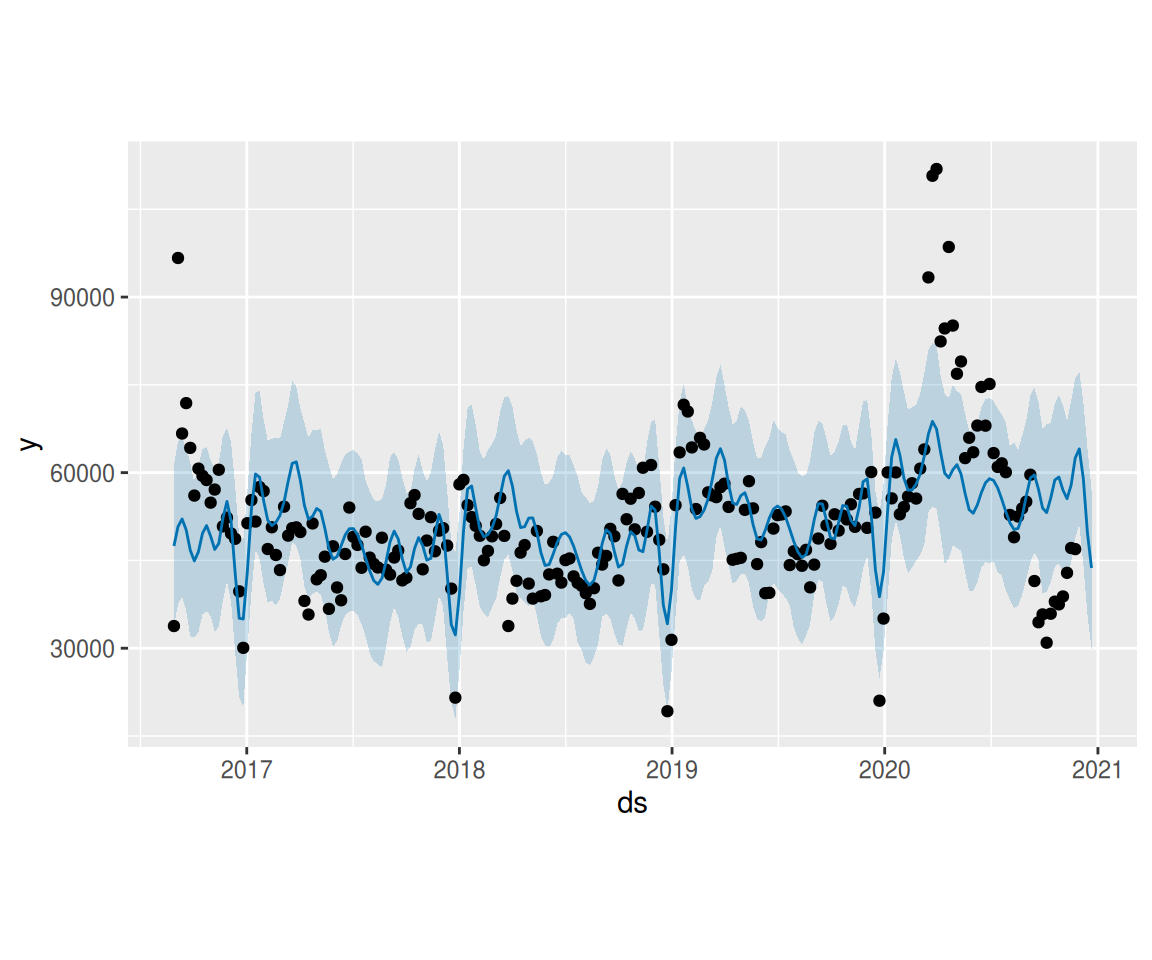
But we can use ggplot2 as well:
1
2
3
4
5
|
ggplot(forecast) +
  geom_line(aes(ds, yhat)) +
  geom_ribbon(aes(x=ds, ymin=yhat_lower, ymax=yhat_upper), alpha = 0.2) +
  geom_point(data = df, aes(ds, y), color = 'blue') +
  NULL
|
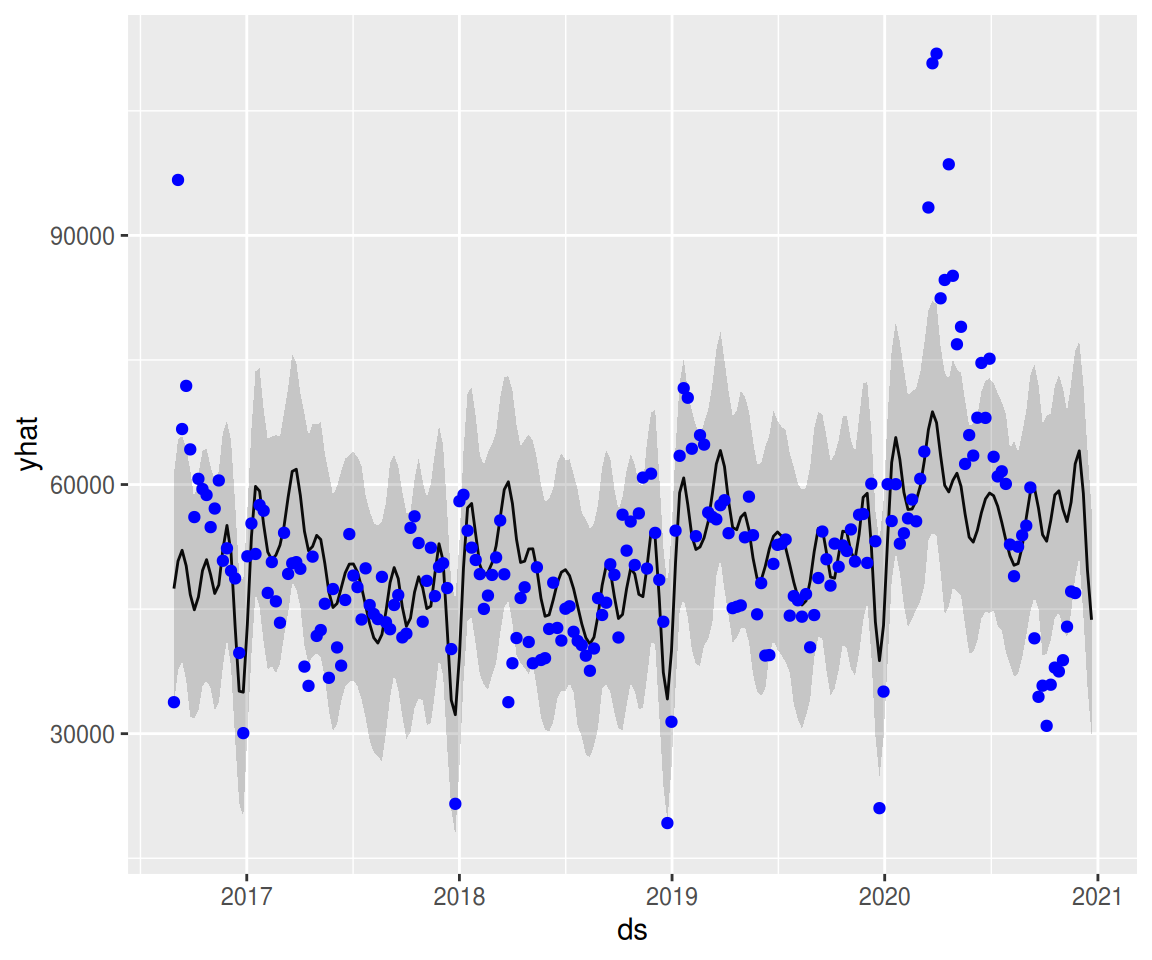
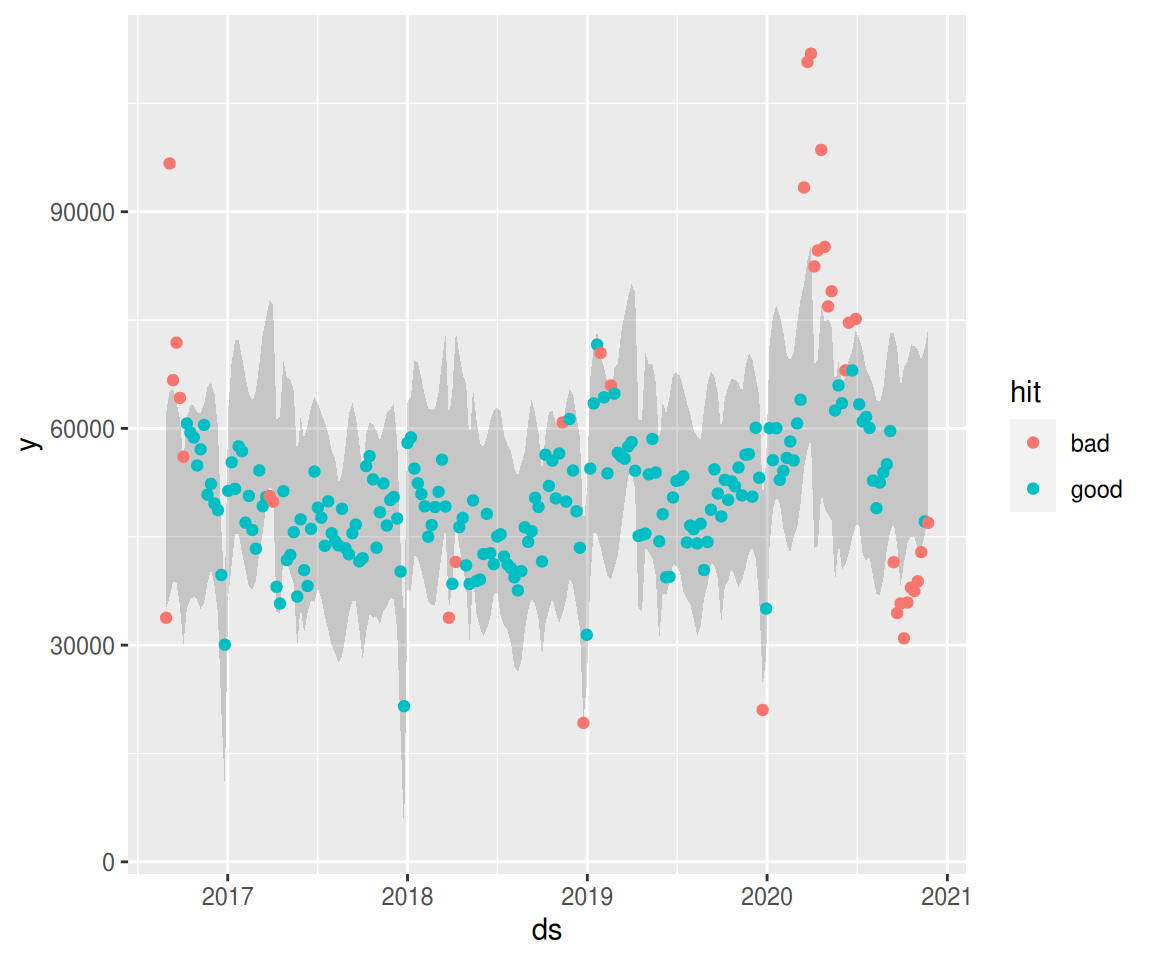
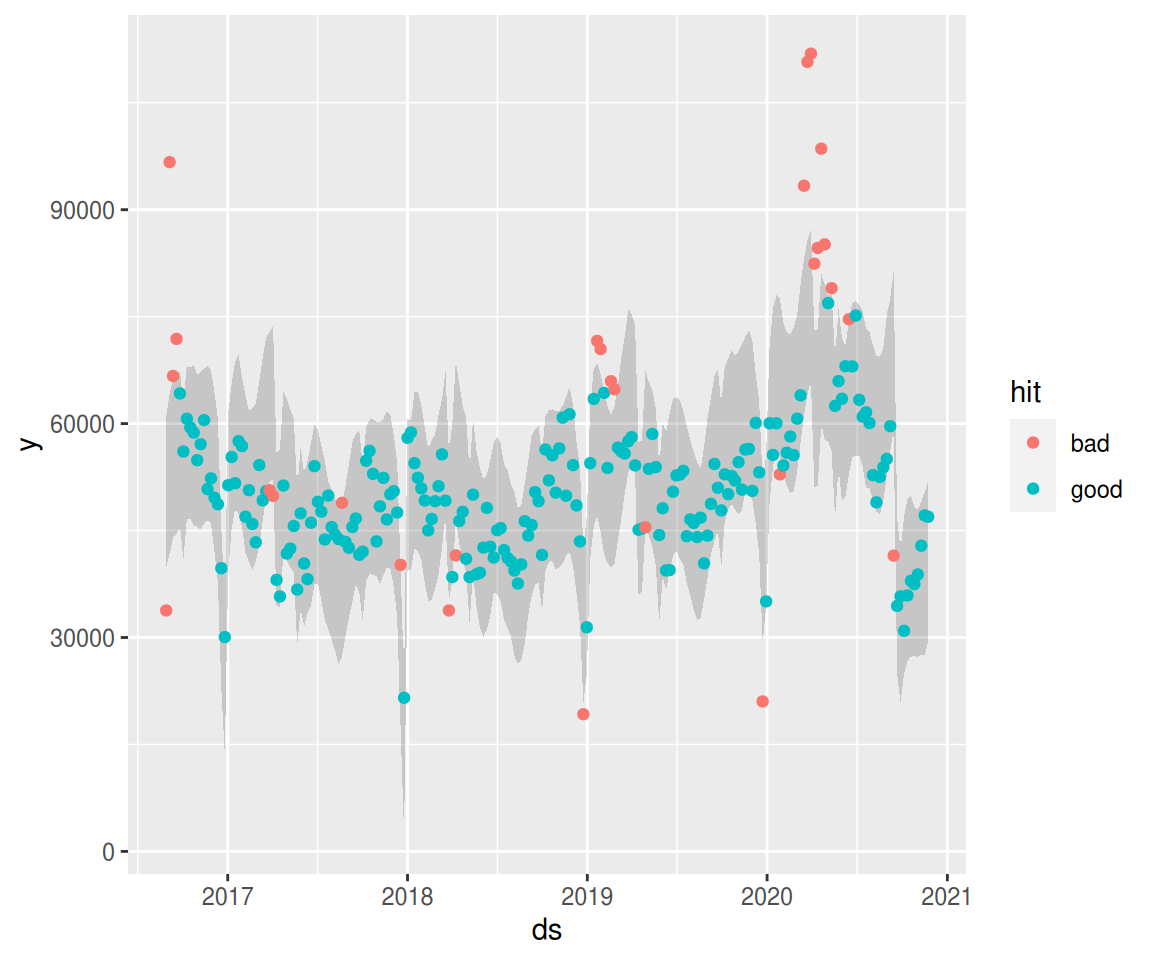
We can even build a function to highlight good and bad predictions:
 1
 2
 3
 4
 5
 6
 7
 8
 9
10
11
12
13
14
|
plot_predictions <- function(data, forecast) {
  data <- forecast %>%
    right_join(data, by = c("ds")) %>%
    mutate(
      hit = ifelse(yhat_lower <= y & y <= yhat_upper, "good", "bad")
    )
  ggplot(data) +
  # geom_line(aes(ds, yhat)) +
  geom_ribbon(aes(x=ds, ymin=yhat_lower, ymax=yhat_upper), alpha = 0.2) +
  geom_point(aes(ds, y, color = hit)) +
  NULL
}

plot_predictions(df, forecast)
|
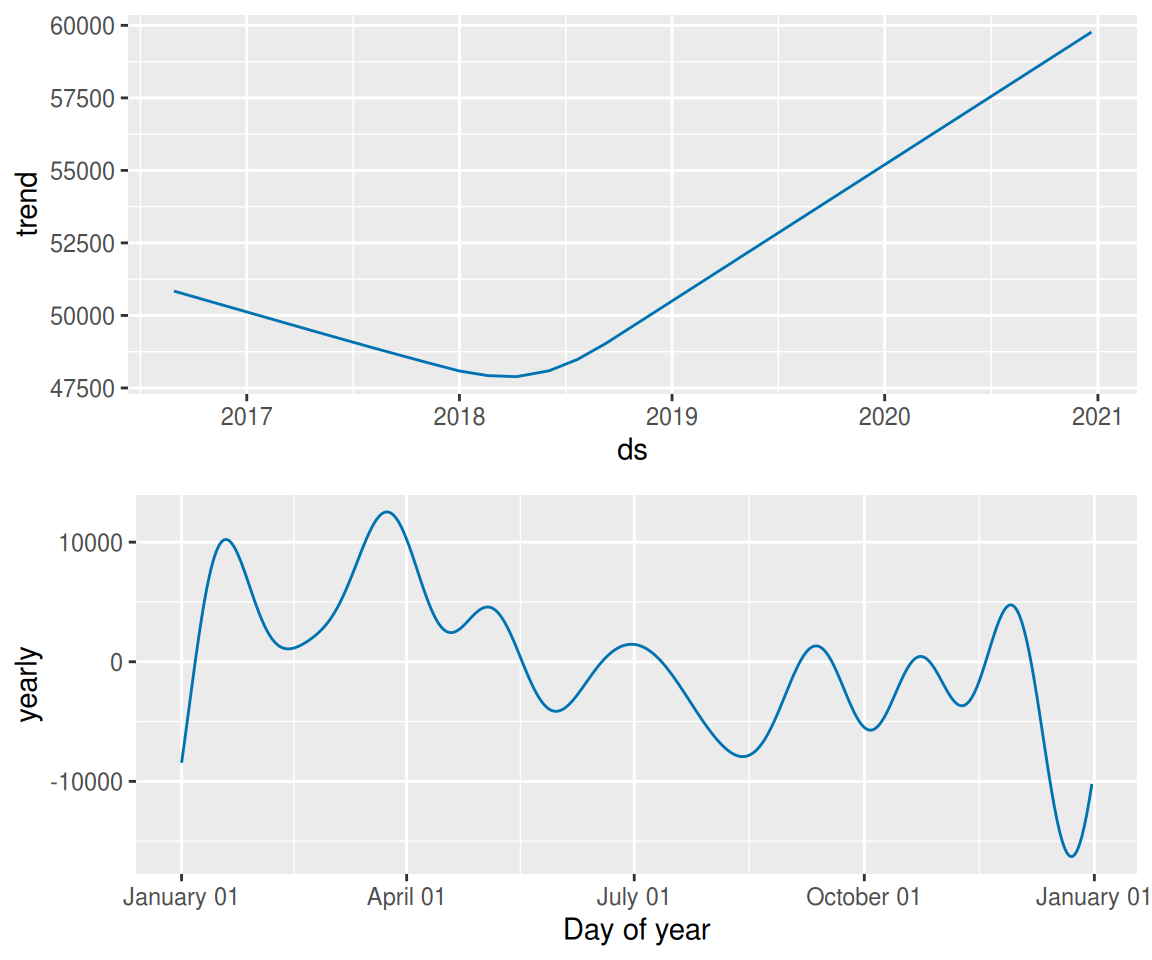
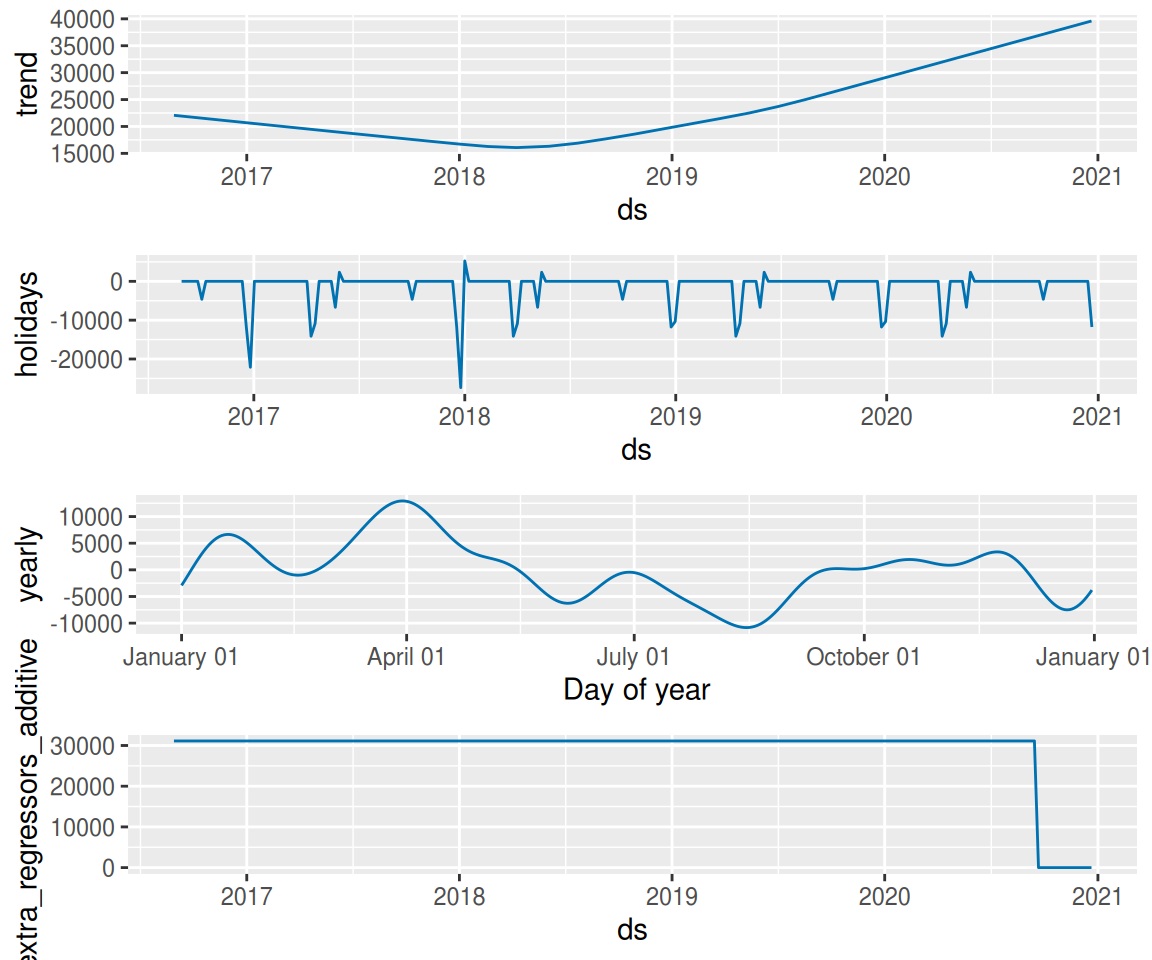
We can also get a visualization of the components:
1
|
prophet_plot_components(m, forecast)
|
Holidays
Prophet can also account holidays as special dates which influences the
depending variable. It contains some predefined holidays.
But in our example we need to normalize (or mondify as I call it) because our
time series only consists of Mondays.
So here’s a lengthy function defining holidays in Germany:
  1
  2
  3
  4
  5
  6
  7
  8
  9
 10
 11
 12
 13
 14
 15
 16
 17
 18
 19
 20
 21
 22
 23
 24
 25
 26
 27
 28
 29
 30
 31
 32
 33
 34
 35
 36
 37
 38
 39
 40
 41
 42
 43
 44
 45
 46
 47
 48
 49
 50
 51
 52
 53
 54
 55
 56
 57
 58
 59
 60
 61
 62
 63
 64
 65
 66
 67
 68
 69
 70
 71
 72
 73
 74
 75
 76
 77
 78
 79
 80
 81
 82
 83
 84
 85
 86
 87
 88
 89
 90
 91
 92
 93
 94
 95
 96
 97
 98
 99
100
101
102
103
104
105
106
107
108
109
110
111
112
113
|
get_holidays <- function(weekly=TRUE){
  new_year <- tibble(
    holiday = "New Year",
    ds = seq(as.Date("2014-01-01"), as.Date("2024-01-01"), "years"),
    lower_window = 0,
    upper_window = 0
  )

  easter_sundays <- as.Date(c('2014-04-20', '2015-04-05', '2016-03-27', '2017-04-16',
                              '2018-04-01', '2019-04-21', '2020-04-12', '2021-04-04',
                              '2022-04-17', '2023-04-09', '2024-03-31'))

  good_fridays <-tibble(
    holiday = 'Good Friday',
    ds = easter_sundays + days(-2),
    lower_window = 0,
    upper_window = 0
  )

  easter_mondays <- tibble(
    holiday = 'Easter Monday',
    ds = easter_sundays + days(1),
    lower_window = 0,
    upper_window = 0
  )


  ascension <- tibble(
    holiday = "Ascension",
    ds = easter_sundays + days(39),
    lower_window = 0,
    upper_window = 0
  )

  pentecost <- tibble(
    holiday = "Pentecost",
    ds = easter_sundays + days(48) + days(1),
    lower_window = 0,
    upper_window = 0
  )

  october_3 <- tibble(
    holiday = "Oktober, 3",
    ds = seq(as.Date("2014-10-03"), as.Date("2024-10-03"), "years"),
    lower_window = 0,
    upper_window = 0
  )

  christmas_24 <- tibble(
    holiday = "Christmas",
    ds = seq(as.Date("2014-12-24"), as.Date("2024-12-24"), "years"),
    lower_window = 0,
    upper_window = 0
  )

  christmas_25 <- tibble(
    holiday = "Christmas",
    ds = seq(as.Date("2014-12-25"), as.Date("2024-12-25"), "years"),
    lower_window = 0,
    upper_window = 0
  )

  christmas_26 <- tibble(
    holiday = "Christmas",
    ds = seq(as.Date("2014-12-26"), as.Date("2024-12-26"), "years"),
    lower_window = 0,
    upper_window = 0
  )

  new_years_eve <- tibble(
    holiday = "New Year's Eve",
    ds = seq(as.Date("2014-12-31"), as.Date("2024-12-31"), "years"),
    lower_window = 0,
    upper_window = 0
  )

  if(weekly){ # Correction for a holiday during weekday
    # Calculate the Monday of the week the given holiday is contained
    mondifyHoliday <- function(holidays) {
      holidays %>%
        mutate(
          dow = (wday(ds) + 5) %% 7 ,
          day = weekdays(ds),
          lower_window = -dow,
          upper_window = 6 - dow,
          ds = ds + days(lower_window),
          lower_window = 0,
          upper_window = 0
        ) %>%
        select(-dow, -day) %>%
        return()
    }

    new_year       <- mondifyHoliday(new_year)
    good_fridays   <- mondifyHoliday(good_fridays)
    easter_mondays <- mondifyHoliday(easter_mondays)
    ascension      <- mondifyHoliday(ascension)
    pentecost      <- mondifyHoliday(pentecost)
    october_3      <- mondifyHoliday(october_3)
    christmas_24   <- mondifyHoliday(christmas_24)
    christmas_25   <- mondifyHoliday(christmas_25)
    christmas_26   <- mondifyHoliday(christmas_26)
    new_years_eve  <- mondifyHoliday(new_years_eve)
  }

  holidays <- bind_rows(new_year, good_fridays, easter_mondays, ascension, pentecost,
                         october_3, christmas_24, christmas_25,
                         christmas_26, new_years_eve)

  return(holidays)
}

get_holidays()
|
 1
 2
 3
 4
 5
 6
 7
 8
 9
10
11
12
13
14
|
## # A tibble: 110 x 4
##    holiday  ds         lower_window upper_window
##    <chr>    <date>            <dbl>        <dbl>
##  1 New Year 2013-12-30            0            0
##  2 New Year 2014-12-29            0            0
##  3 New Year 2015-12-28            0            0
##  4 New Year 2016-12-26            0            0
##  5 New Year 2018-01-01            0            0
##  6 New Year 2018-12-31            0            0
##  7 New Year 2019-12-30            0            0
##  8 New Year 2020-12-28            0            0
##  9 New Year 2021-12-27            0            0
## 10 New Year 2022-12-26            0            0
## # … with 100 more rows
|
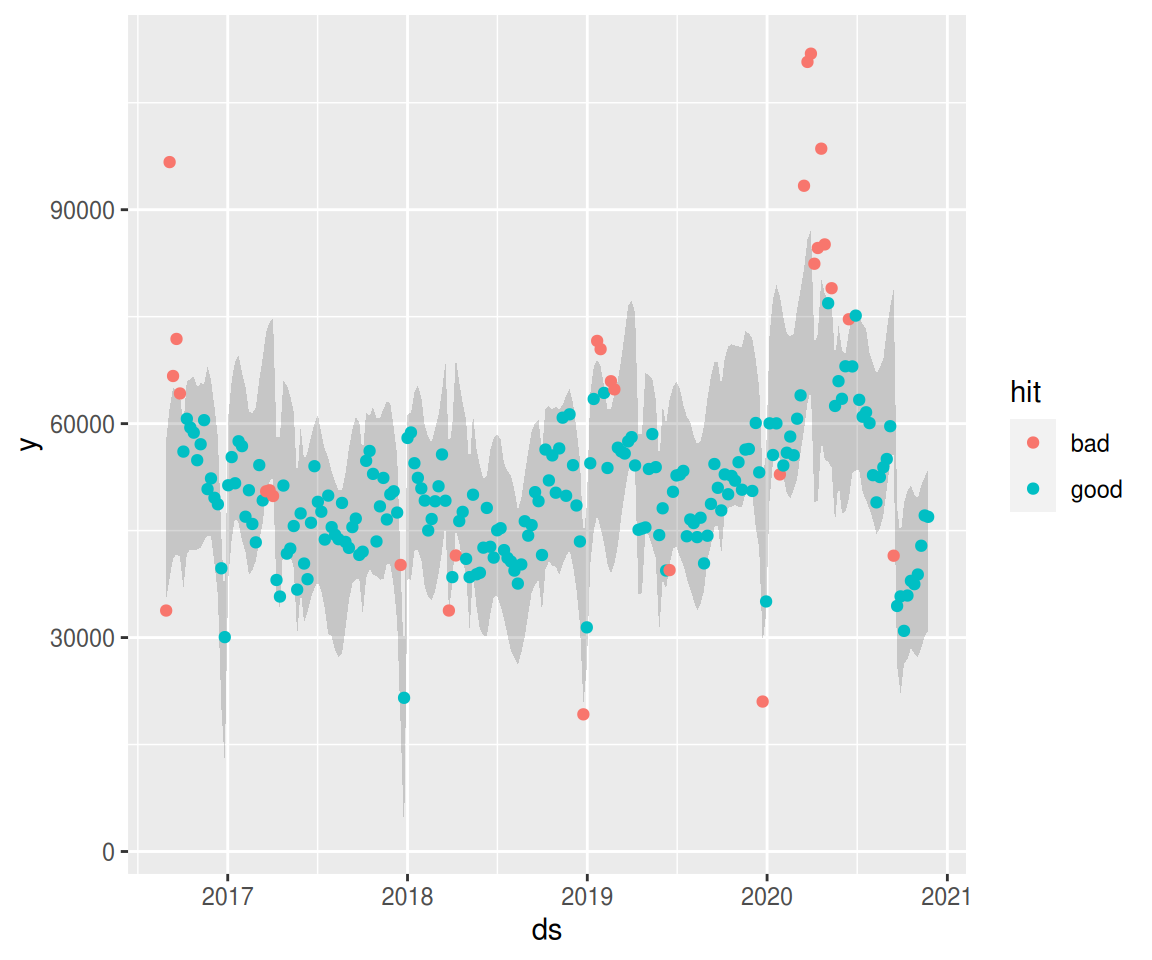
If we provide prophet these holidays it adjusts the model.
1
2
3
|
holidays <- get_holidays(weekly=TRUE)

m <- prophet(df, holidays = holidays, yearly.seasonality=TRUE)
|
1
|
## Disabling weekly seasonality. Run prophet with weekly.seasonality=TRUE to override this.
|
1
|
## Disabling daily seasonality. Run prophet with daily.seasonality=TRUE to override this.
|
1
2
3
4
5
6
7
|
future <- make_future_dataframe(m, periods = horizon)
future <- future %>%
      filter(wday(ds) == 2) # only mondays
forecast <- predict(m, future) %>%
      mutate(ds = as.Date(ds))

plot_predictions(df, forecast)
|
1
|
prophet_plot_components(m, forecast)
|
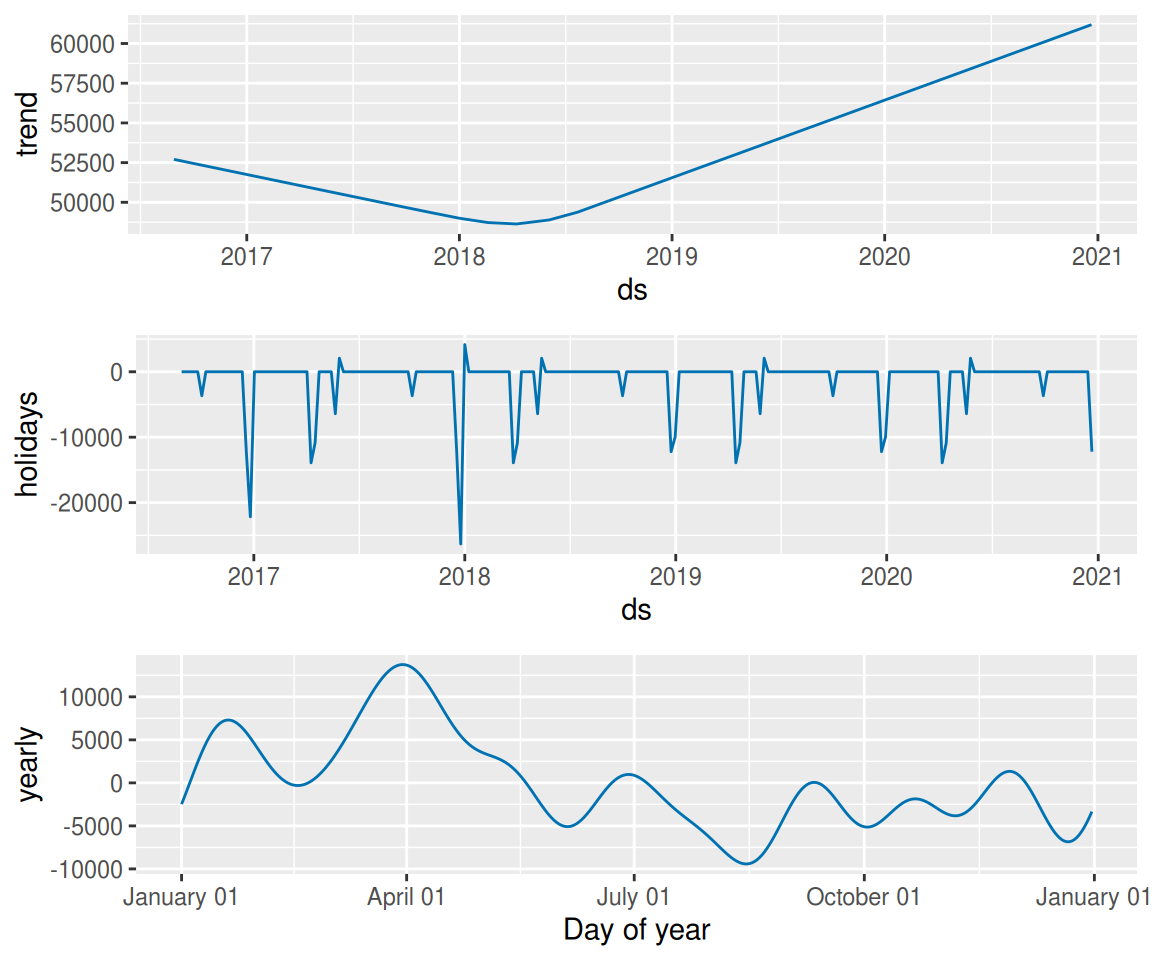
As we can see the drops at New Year are slightly better predicted.
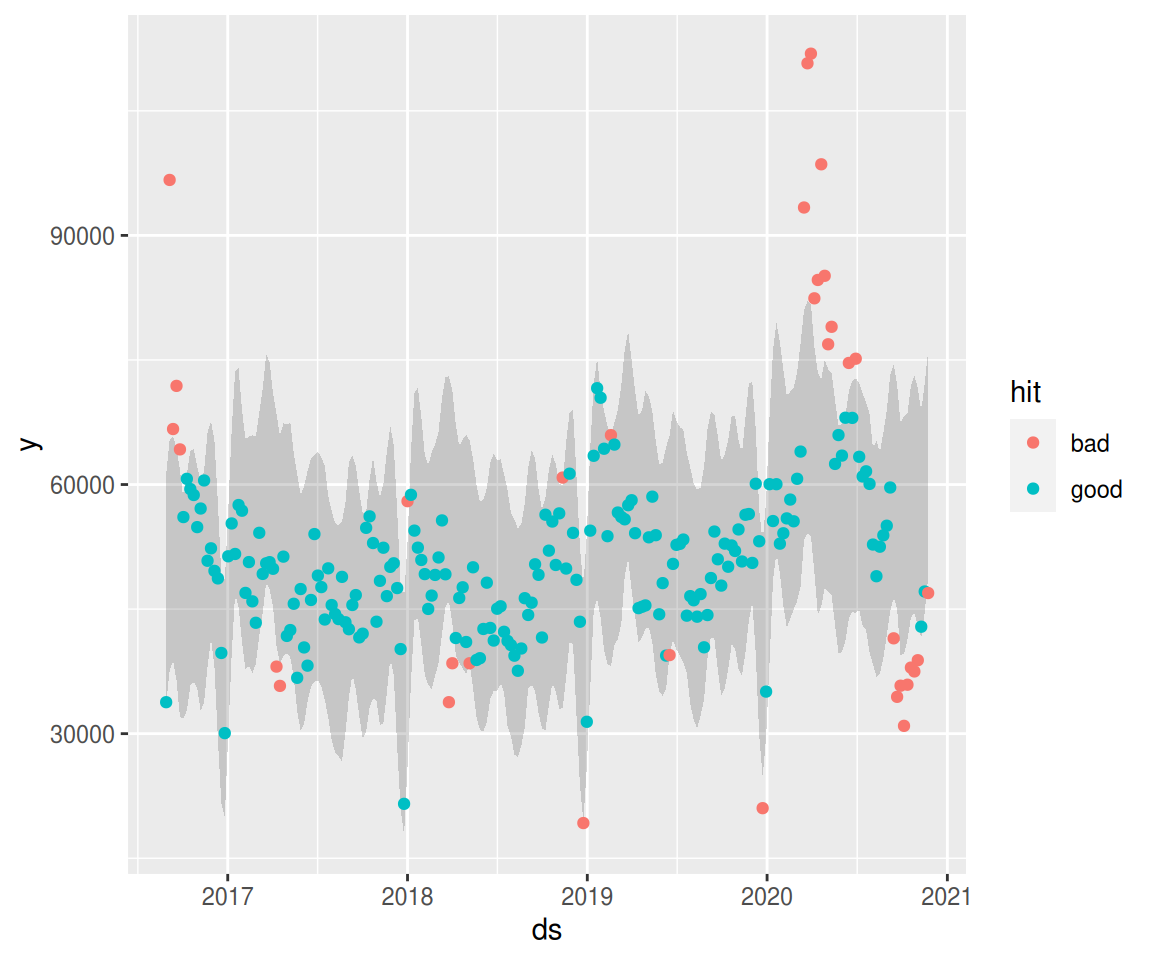
Consent Layer or What happened in 2020?
In late 2020 the predictions are too high. The truth is much lower.
So what happened in reallity?
The answer is simple: Because of GDPR a consent layer was implemented asking
the user if she accepts the tracking via Google Analytics or if she
declines it.
When she declined it she still could access the website but she
weren’t tracked anymore. So it seemed there were less sessions.
So how can we adjust the model?
Additional Prediction Parameters
We can add an additional regressor which indicates whether the
consent layer was active or not.
1
2
3
4
|
# The consent layer is active since 2020-09-16
has_consent_layer <- function(ds){
  ds < ymd("2020-09-16")
}
|
1
2
3
4
|
df_consent <- df %>%
  mutate(consent_layer = has_consent_layer(ds))

df_consent
|
 1
 2
 3
 4
 5
 6
 7
 8
 9
10
11
12
13
14
|
## # A tibble: 222 x 3
##    ds             y consent_layer
##    <date>     <dbl> <lgl>
##  1 2016-08-29 33789 TRUE
##  2 2016-09-05 96677 TRUE
##  3 2016-09-12 66682 TRUE
##  4 2016-09-19 71878 TRUE
##  5 2016-09-26 64230 TRUE
##  6 2016-10-03 56080 TRUE
##  7 2016-10-10 60685 TRUE
##  8 2016-10-17 59456 TRUE
##  9 2016-10-24 58737 TRUE
## 10 2016-10-31 54871 TRUE
## # … with 212 more rows
|
There are two ways to add the additional regressor:
- additive and
- mulitplicative
The difference is if the effect of this regressor is additive or
multiplicative. In our use case I think multiplactive is a good
choice because in reallity a certain fraction of all users will
decline the tracking pixel.
Additive Additional Regressor
1
2
3
|
m <- prophet(holidays = holidays, yearly.seasonality=TRUE)
m <- add_regressor(m, 'consent_layer', mode = 'additive')
m <- fit.prophet(m, df_consent)
|
1
|
## Disabling weekly seasonality. Run prophet with weekly.seasonality=TRUE to override this.
|
1
|
## Disabling daily seasonality. Run prophet with daily.seasonality=TRUE to override this.
|
 1
 2
 3
 4
 5
 6
 7
 8
 9
10
|
future <- make_future_dataframe(m, periods = horizon) %>%
  mutate(ds = ymd(ds))
future <- future %>%
        filter(wday(ds) == 2) # only mondays
future <- future %>%
  mutate(consent_layer = has_consent_layer(ds))

forecast <- predict(m, future)

plot_predictions(df, forecast)
|
1
|
prophet_plot_components(m, forecast)
|
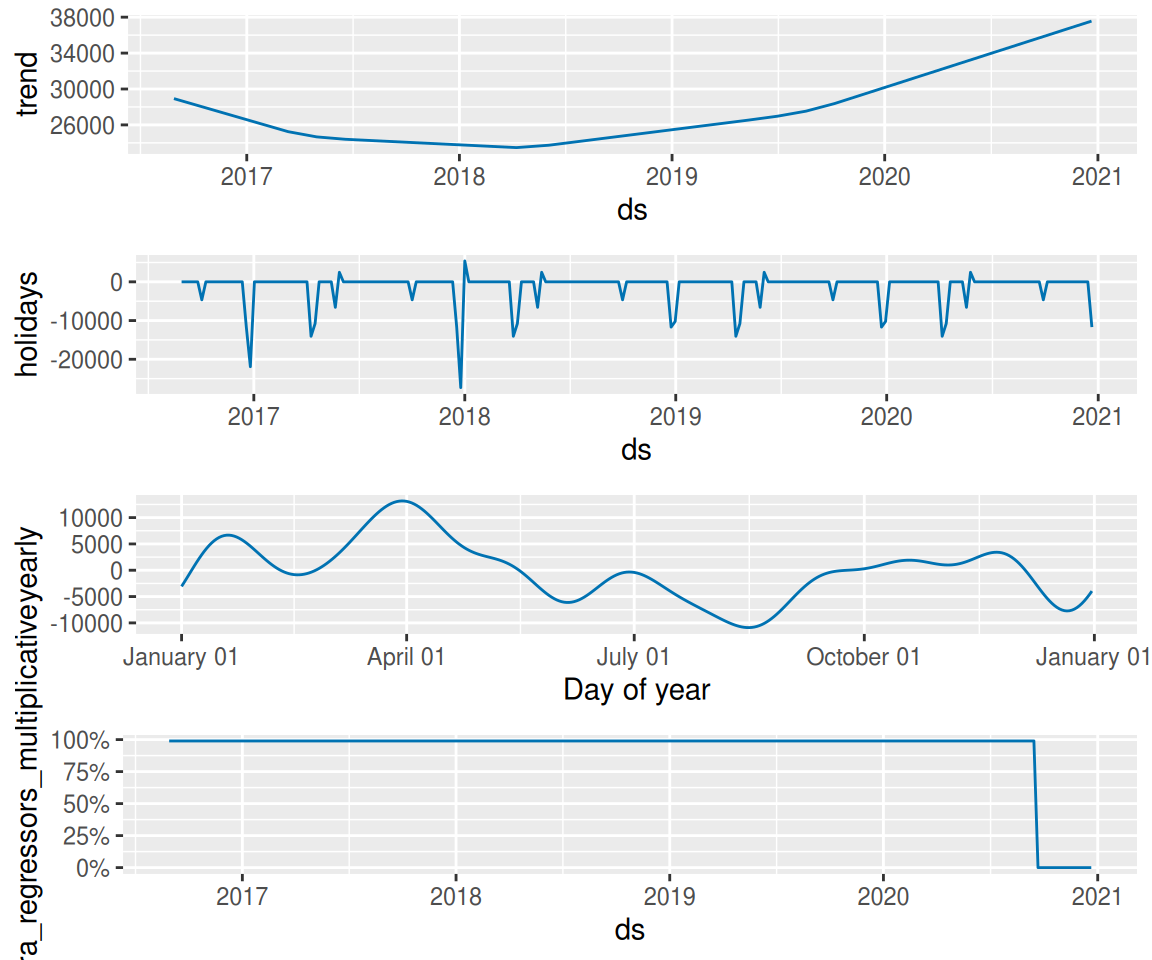
Multiplicative Additional Regressor
1
2
3
|
m <- prophet(holidays = holidays, yearly.seasonality=TRUE)
m <- add_regressor(m, 'consent_layer', mode = 'multiplicative')
m <- fit.prophet(m, df_consent)
|
1
|
## Disabling weekly seasonality. Run prophet with weekly.seasonality=TRUE to override this.
|
1
|
## Disabling daily seasonality. Run prophet with daily.seasonality=TRUE to override this.
|
 1
 2
 3
 4
 5
 6
 7
 8
 9
10
|
future <- make_future_dataframe(m, periods = horizon) %>%
  mutate(ds = ymd(ds))
future <- future %>%
        filter(wday(ds) == 2) # only mondays
future <- future %>%
  mutate(consent_layer = has_consent_layer(ds))

forecast <- predict(m, future)

plot_predictions(df, forecast)
|
1
|
prophet_plot_components(m, forecast)
|
The Anomaly Detection
So is there any anomaly during the last number_of_weeks weeks?
Let’s pimp our plotting function:
 1
 2
 3
 4
 5
 6
 7
 8
 9
10
11
12
13
14
15
16
17
18
19
20
21
22
23
24
25
26
27
28
29
|
plot_anomaly <- function(data, forecast) {
  # adjust field names of data
  data <- data %>%
    rename(
      ds = date,
      y = sessions
    )

  data <- forecast %>%
    mutate(
      ds = ymd(ds)
    ) %>%
    left_join(data, by = c("ds")) %>%
    mutate(
      hit = ifelse(yhat_lower <= y & y <= yhat_upper, "good", "bad")
    ) %>%
    mutate(
      prediction = ds > end_date
    ) %>%
    tail(horizon + 10)

  ggplot(data) +
  geom_line(aes(ds, yhat), color = "gray60") +
  geom_ribbon(aes(x=ds, ymin=yhat_lower, ymax=yhat_upper), alpha = 0.2) +
  geom_point(aes(ds, y, color = hit, shape = prediction)) +
  NULL
}

plot_anomaly(data, forecast)
|
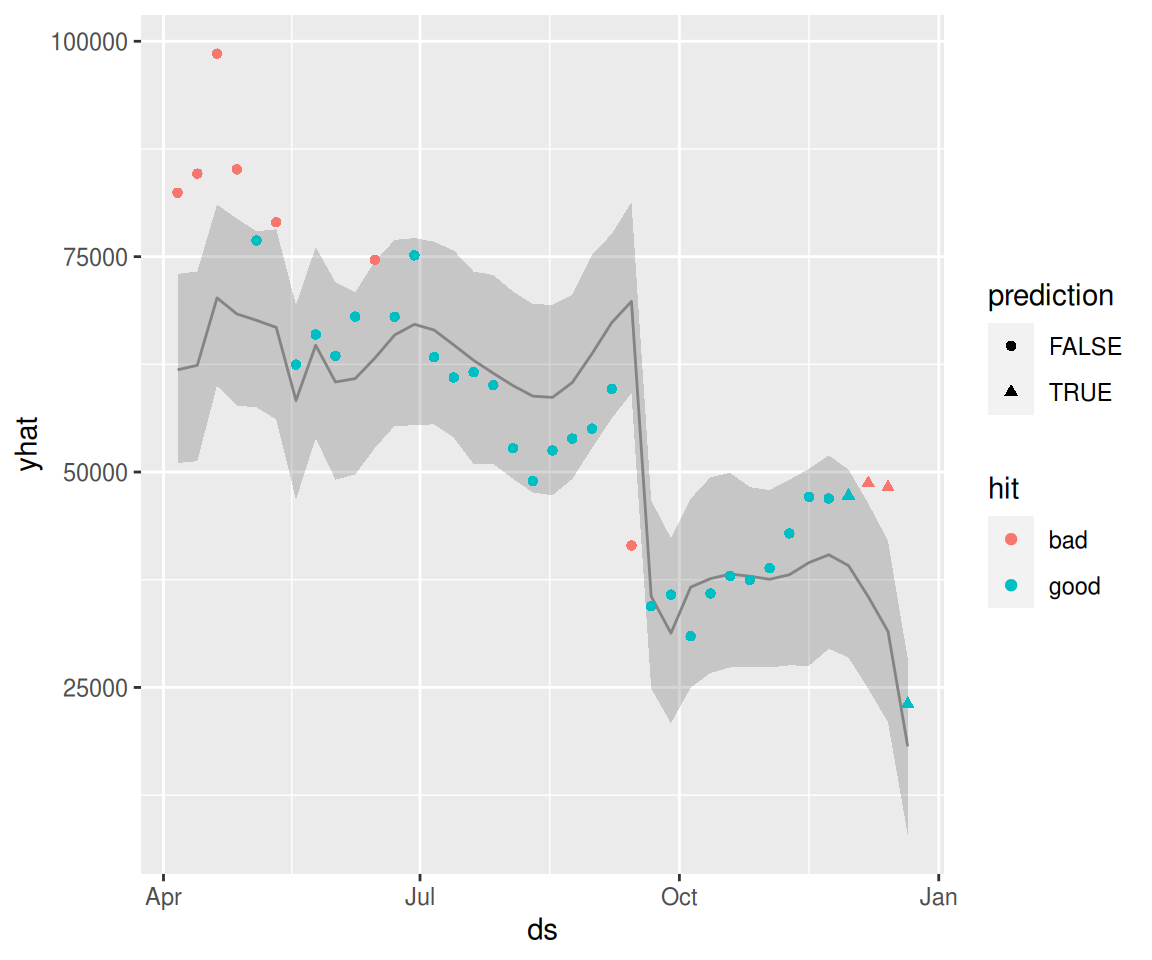
So we’ve trained our model without the last number_of_weeks weeks. Now we predict
these weeks. The predictions are shown as triangles.
As we can see two weeks were slightly better than predicted, the other two fall within
the prediction corridor.
So there was no big anomaly within the last four weeks.