Sometimes you generate lots of ggplots of a similar kind, e.g. visualizations of
different timeseries. Then you want to highlight some dates where something
special had happened and you want to show that the value you are plotting changed
at these dates.
So it would be nice if we can refactor these geom_vline or geom_hline calls
into one single function.
Unfortunately the straight way using
1
2
3
4
5
|
add_lines <- function() {
  geom_vline(xintercept = ymd("2019-07-01"), color = "green") +
  geom_vline(xintercept = ymd("2021-01-01"), color = "red") +
  geom_hline(yintercept = c(0, 12), color = "blue")
}
|
does not work:
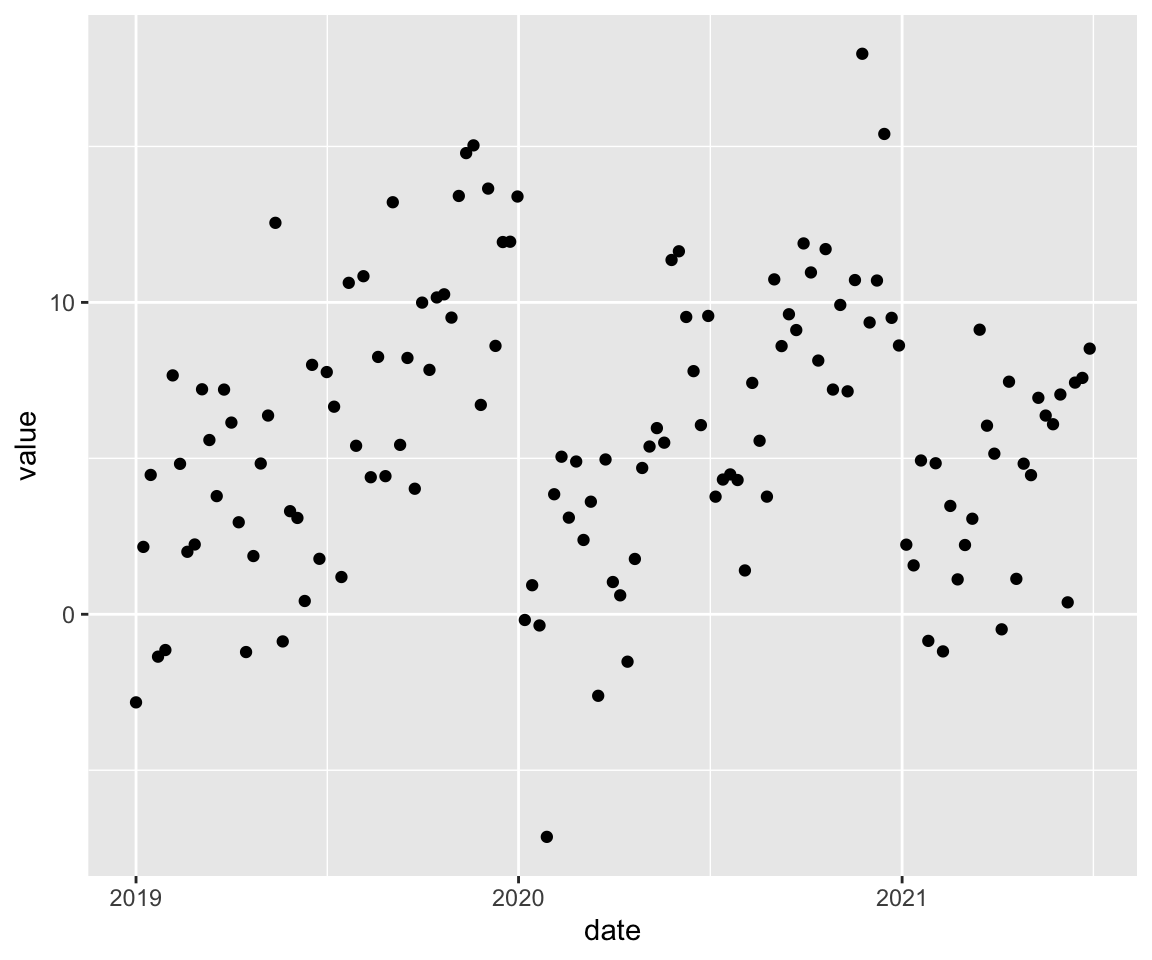
But let’s start with an example:
 1
 2
 3
 4
 5
 6
 7
 8
 9
10
11
12
13
14
15
16
17
|
library(ggplot2)
library(dplyr, warn.conflicts = FALSE)
library(lubridate, warn.conflicts = FALSE)

data <- tibble(
  date = seq(from = ymd("2019-01-01"), to = ymd("2021-06-30"), by = "week"),
) %>%
  rowwise() %>%
  mutate(
    value = month(date) + rnorm(1, mean = 0, sd = 3)
  )

plot <- data %>%
  ggplot(aes(date, value)) +
  geom_point()

plot
|
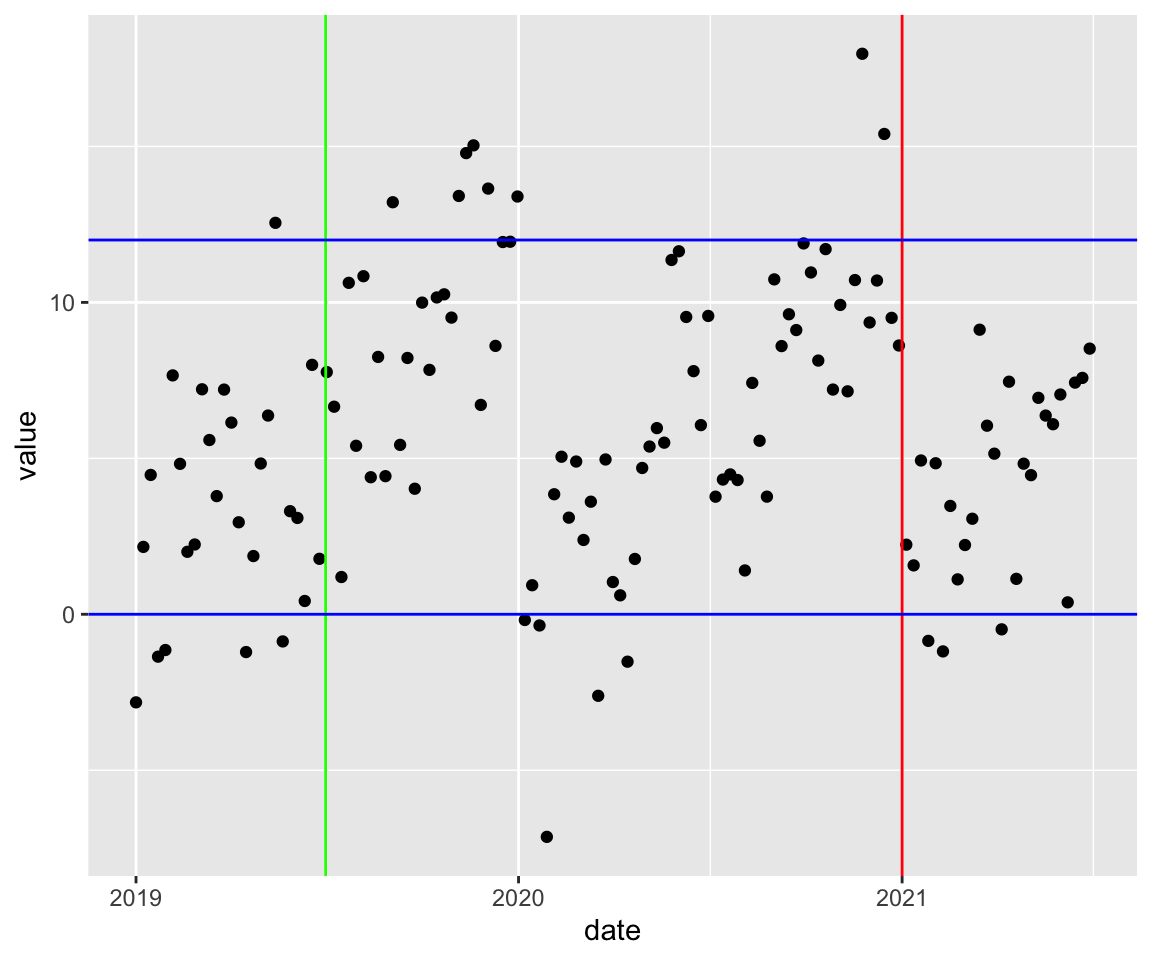
Now we want to add some vertical and horizontal lines to plot:
1
2
3
4
|
plot +
  geom_vline(xintercept = ymd("2019-07-01"), color = "green") +
  geom_vline(xintercept = ymd("2021-01-01"), color = "red") +
  geom_hline(yintercept = c(0, 12), color = "blue")
|

So let’s try it and use a function for adding these lines:
1
|
## Error: Cannot add ggproto objects together. Did you forget to add this object to a ggplot object?
|
So we have to choose another way. The function should return instead of the sum
of the function calls a list of these
geom-calls!
1
2
3
4
5
6
7
8
9
|
add_lines_to_plot <- function() {
  list(
    geom_vline(xintercept = ymd("2019-07-01"), color = "green"),
    geom_vline(xintercept = ymd("2021-01-01"), color = "red"),
    geom_hline(yintercept = c(0, 12), color = "blue")
  )
}

plot + add_lines_to_plot()
|
Now it’s easy to reuse this function and add the same lines to other plots.