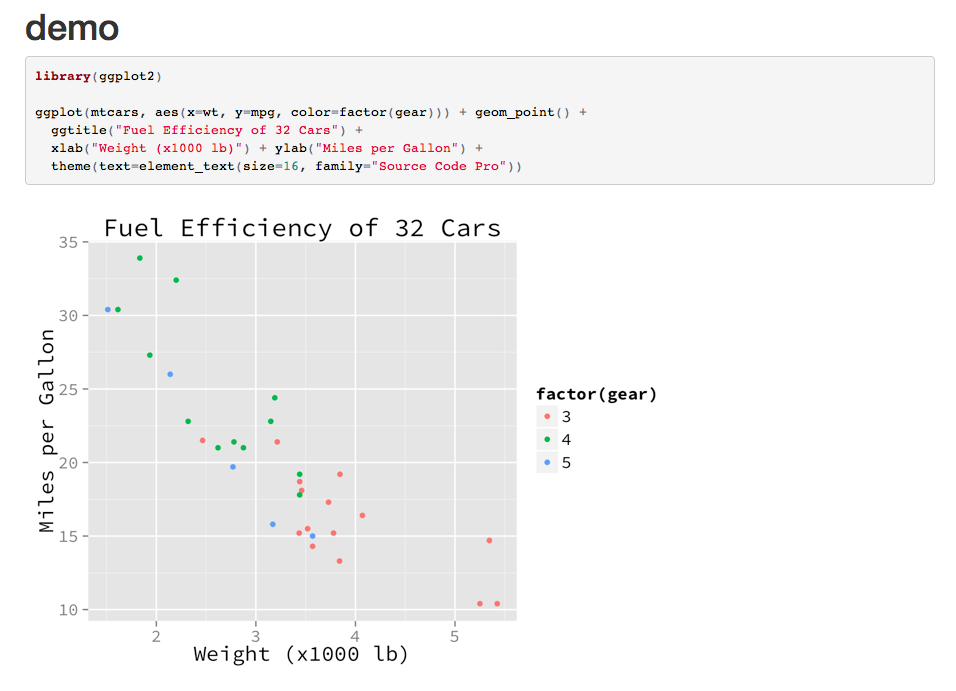
As I mentioned earlier I’ve wanted to use otf-fonts in ggplot2-graphics
Rmd-Files
The next step is to use them in Knitr‘s
RMarkdown-documents. That’s simple: Just use it as I showed earlier.
 1
 2
 3
 4
 5
 6
 7
 8
 9
10
11
|
title: "demo"
output: html_document

```{r}
 library(ggplot2)

 ggplot(mtcars, aes(x=wt, y=mpg, color=factor(gear))) + geom_point() +
  ggtitle("Fuel Efficiency of 32 Cars") +
  xlab("Weight (x1000 lb)") + ylab("Miles per Gallon") +
  theme(text=element_text(size=16, family="Source Code Pro"))
```
|

Rnw-Files
But using these fonts in Rnw-files — that’s embedded R-code in LaTeX-files — seems to be a little more complex.
 1
 2
 3
 4
 5
 6
 7
 8
 9
10
11
12
13
14
|
\documentclass{article}

\begin{document}

< <message=FALSE, echo=FALSE>>=
Sys.setenv(LANG = "en")
library(ggplot2, quietly=TRUE)

ggplot(mtcars, aes(x=wt, y=mpg, color=factor(gear))) + geom_point() +
  ggtitle("Fuel Efficiency of 32 Cars") +
  xlab("Weight (x1000 lb)") + ylab("Miles per Gallon") +
  theme(text=element_text(family="Source Code Pro"))
@
\end{document}
|
This document produces an error:
1
2
3
4
|
Error in grid.Call.graphics(L_text, as.graphicsAnnot(x$label), x$x, x$y,  :
  invalid font type
Calls: knit ... drawDetails -> drawDetails.text -> grid.Call.graphics
In addition: There were 50 or more warnings (use warnings() to see the first 50)
|
So I was looking for a work around.
Using Cairo
I’ve found the Cairo-device.
 1
 2
 3
 4
 5
 6
 7
 8
 9
10
11
12
13
14
15
16
17
|
\documentclass{article}

\begin{document}
<<>>=
Sys.setenv(LANG = "en")
library(Cairo)
library(ggplot2, quietly=TRUE)
@

<<message=FALSE, echo=FALSE, dev='cairo_pdf'>>=
ggplot(mtcars, aes(x=wt, y=mpg, color=factor(gear))) + geom_point() +
  ggtitle("Fuel Efficiency of 32 Cars") +
  xlab("Weight (x1000 lb)") + ylab("Miles per Gallon") +
  theme(text=element_text(family="Source Code Pro"))
@

\end{document}
|
But this generates lots of warnings.
1
|
## Warning in grid.Call(LtextBounds, as.graphicsAnnot(x$label), x$x,x$y, : font family 'Source Code Pro' not found in PostScript fontdatabase
|
So I suppress warnings in the ggplot-chunk:
 1
 2
 3
 4
 5
 6
 7
 8
 9
10
11
12
13
14
15
16
17
18
|
\documentclass{article}

\begin{document}
<<>>=
Sys.setenv(LANG = "en")
library(Cairo)
library(ggplot2, quietly=TRUE)
@

<<message=FALSE, echo=FALSE, dev='cairo_pdf', warning=FALSE>>=
ggplot(mtcars, aes(x=wt, y=mpg, color=factor(gear))) + geom_point() +
  ggtitle("Fuel Efficiency of 32 Cars") +
  xlab("Weight (x1000 lb)") + ylab("Miles per Gallon") +
  theme(text=element_text(family="Source Code Pro"))
@


\end{document}
|
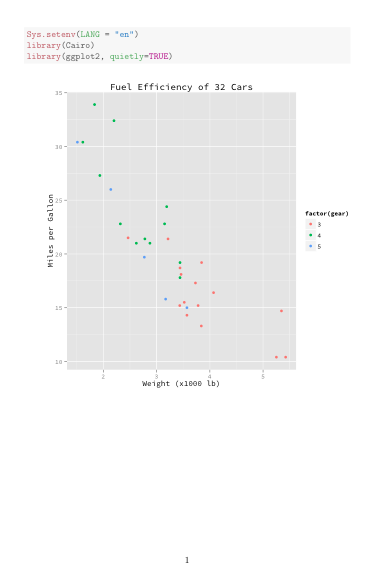
and tata:


