Doing A/B-testing with Google Analytics and R
Contents
There are several ways for A/B-Testing with Google Analytics. First you can use the Google way. Google calls it [Content Experiments](https://support.google.com/analytics/answer/1745147?hl=en. But you have to define a goal when you set up an experiment.
If you want to investigate several metrics I thinks the better way is to do the analysis on your own. Use Google Analytics to create the data. But do the analysis on your own.
But first I’d like to summarize what I’d like to do:
Say, you have two different versions of your website, e.g. one is simply black and white, the other one is very colourful. Or, the first one uses one font the other one uses another one. When a user visits the website for the first time, your webserver flips a virtual coin and delivers the website with feature A or feature B. After that each request made in this session gets the same version. Then you may ask “Which version does have the lower bounce rate?” or “On which version does the user stay longer?”.
Setup in Google Analytics
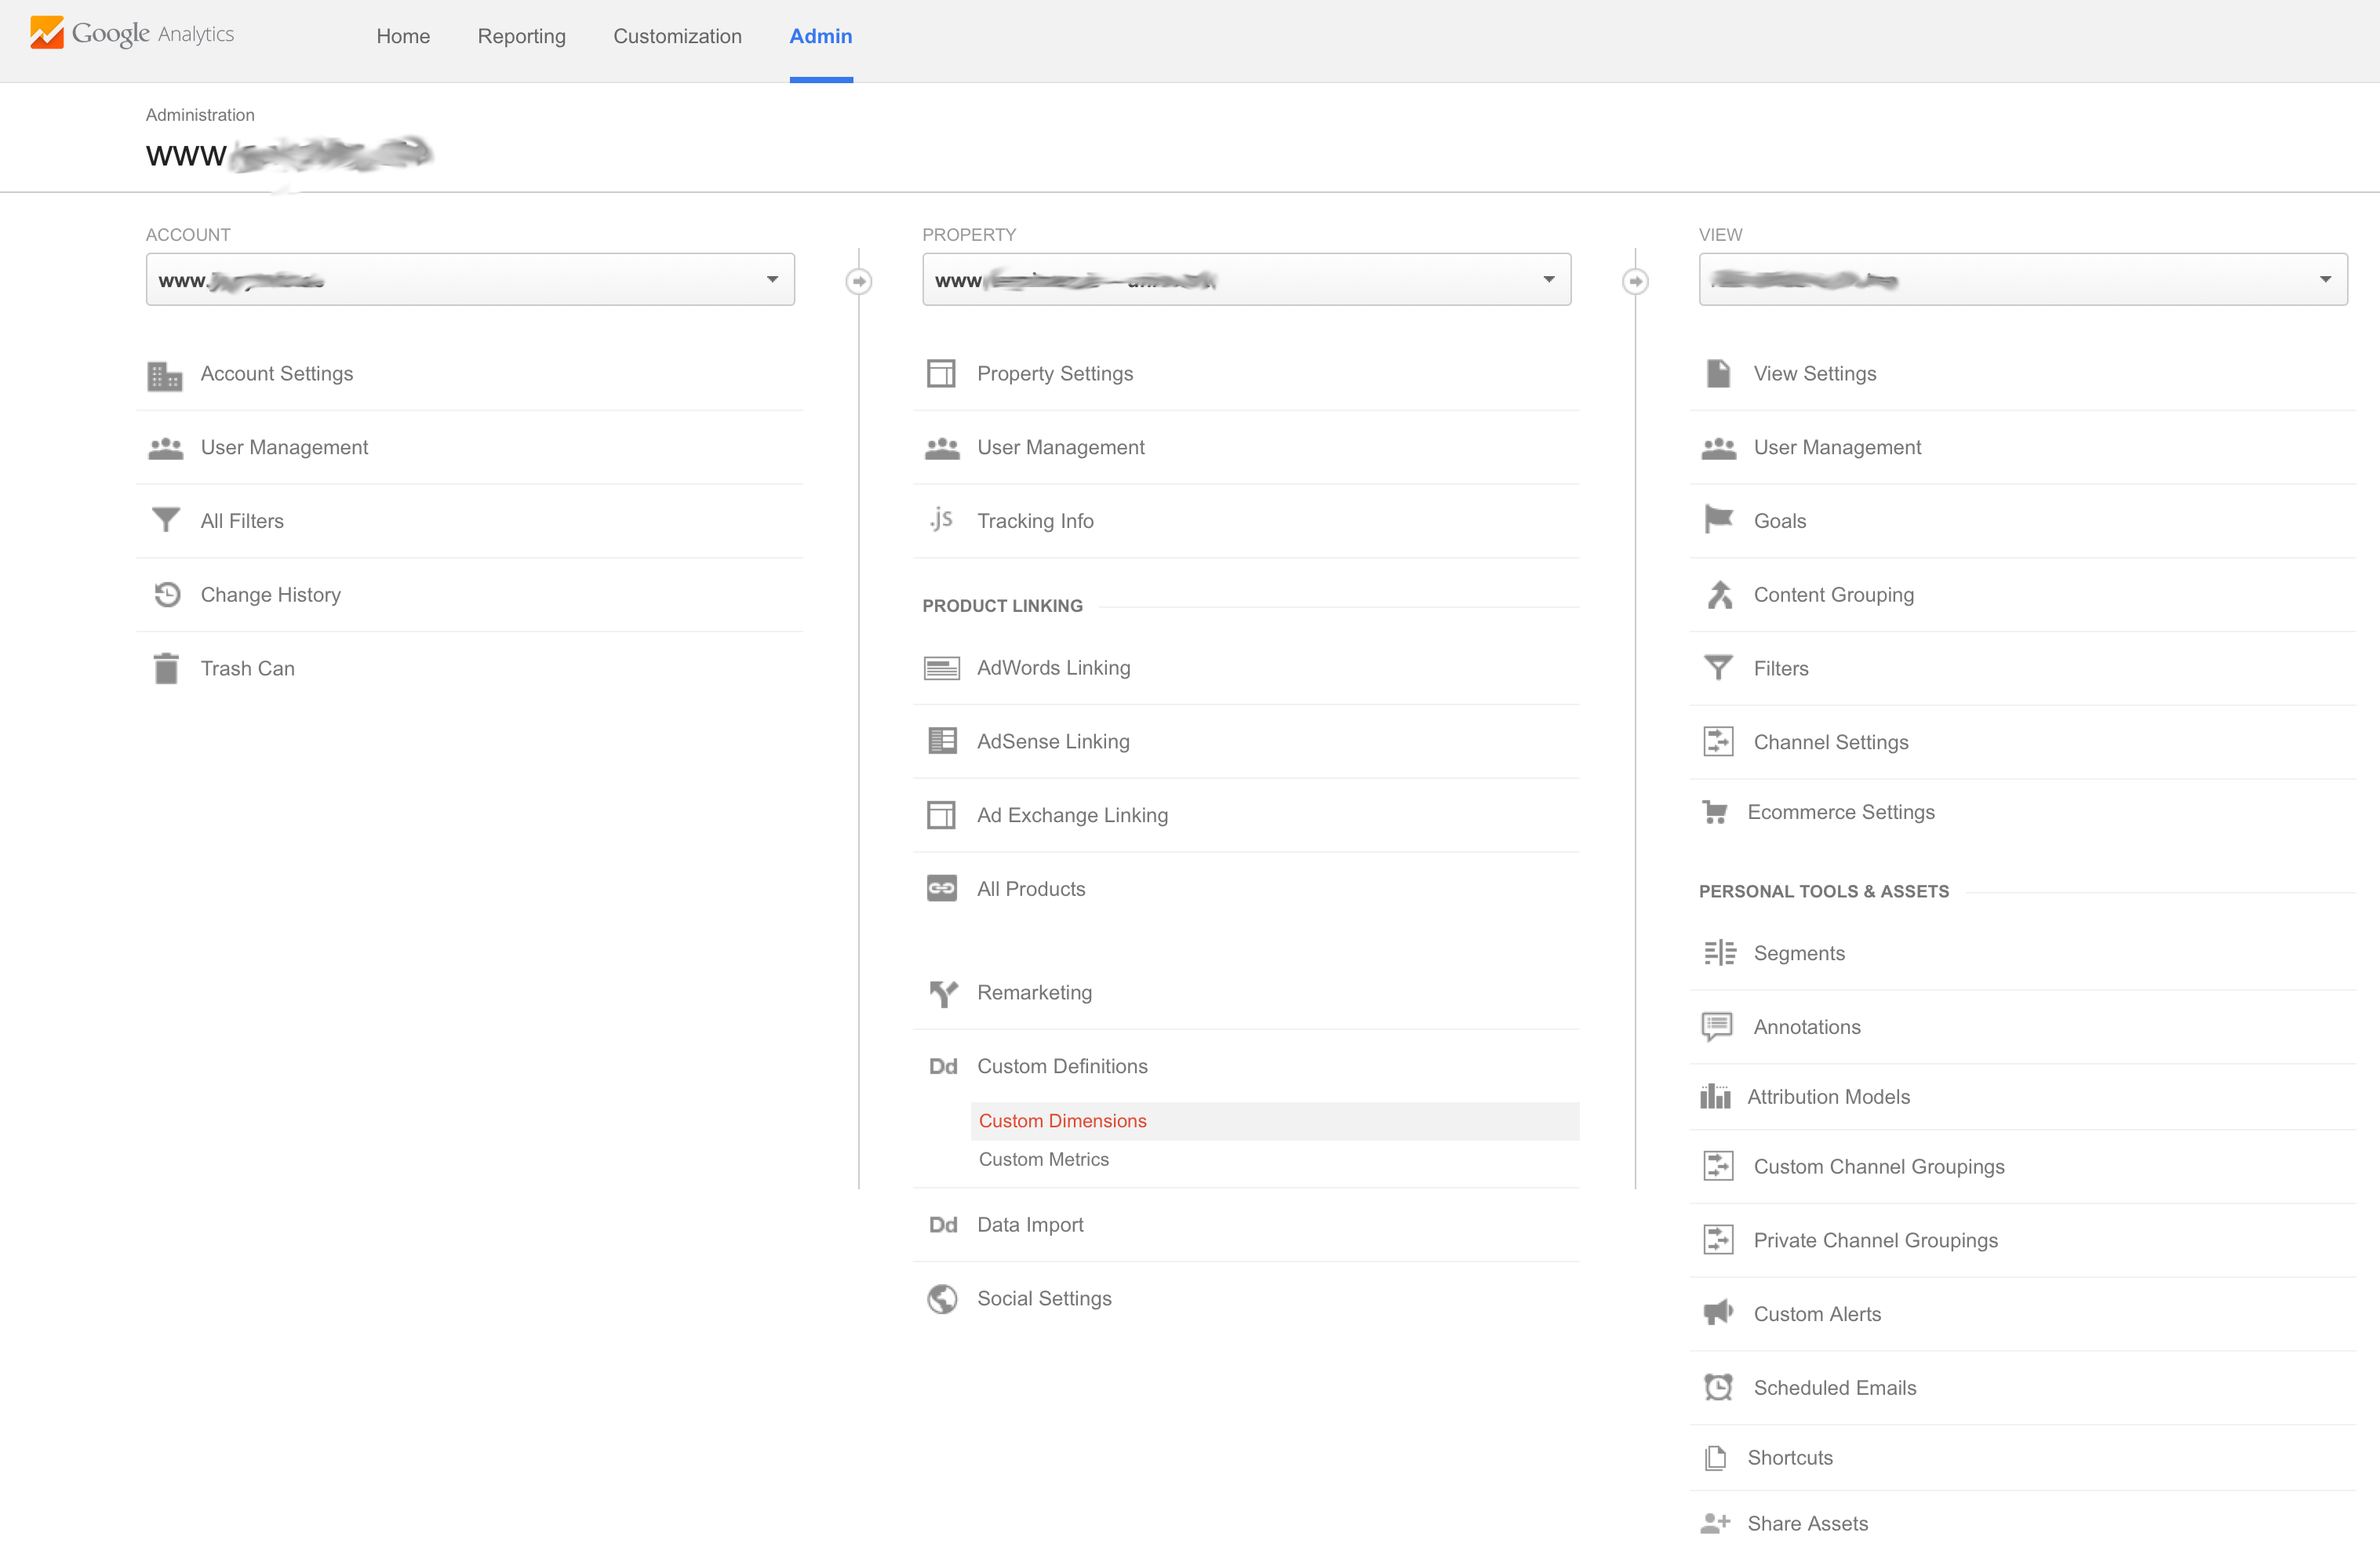
First you have to create a custom dimension to distinguish users shown the different versions. You do this in the “Admin” menu of your Google Analytics account:
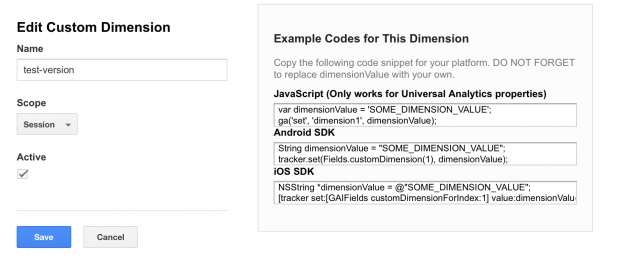
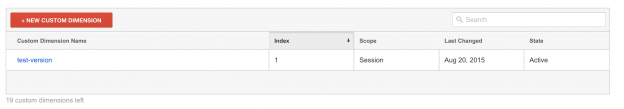
Here I name my custom dimension “test-version”. It’s my first custom dimension:
The scope of your new custon dimension describes the duration a value of this dimension. You can set it to hit (just for this page), to session (for the whole session) or to user. We need here a session-based dimension. (See Google’s docs for detailed information.)
You can define up to 20 custom dimensions. (If you’d like to use more you have to buy Google Analytics premium.)
Delivering the data
After creating the new custom dimension you have to provide the correct value every time a user hits your page. Just put the line
|
|
into the analytics tracking code.
|
|
“dimensionValue” is either “versionA” / “versionB” or “yes” / “no”. You have to set it according to the version of the website user gets delivered.
Analysis
Using RGoogleAnalytics for retrieving the data you can analyse the different versions of your website.
With the following query you can get various metrics split by day and our custom dimension:
|
|
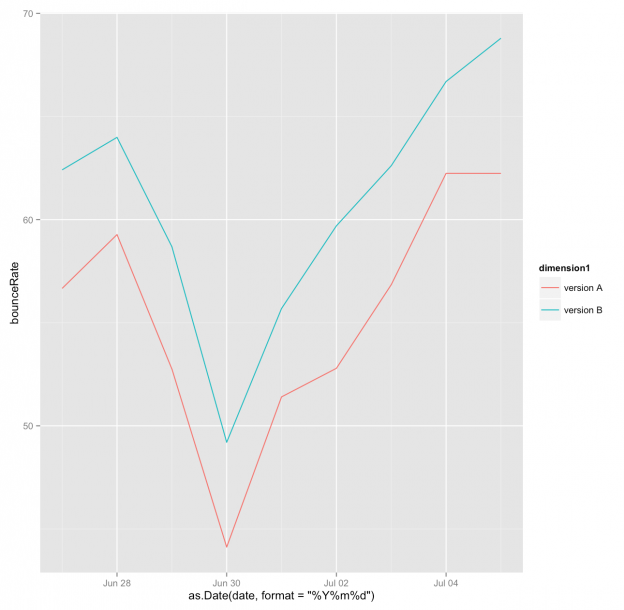
Plotting the data with ggplot2
|
|
But what about statistical significance?
So let’s get the data:
|
|
With this data
|
|
we can perform a chi-squared-test:
|
|
The output shows that the result is significant:
|
|
For a more complex scenario see part 2