Doing A/B-testing with Google Analytics and R, Part 2
Recently I described a way to do [A/B-testing with Google Analytics and R](/2015/08/20/doing-a-b-testing-with-google-analytics-and-r/. I wrote about tests with a two-way outcome: bounced or not bounced.
But what do we do when the metric has more than two possible outcomes? Let’s say something like sessionDuration or pageLoadTime. Then Google just gives you an aggregated value like avgSessionDuration or avgPageLoadTime. You don’t get any information about the distribution of this metric.
So you have to do it on your own! As I showed the last time we define another customDimension. This customDimension gets an unique value for every session. Using php you can do something like this
|
|
The salt is required to hide the real session-id.
Once this value is added as customDimension to Google Analytics
|
|
we can use it to separate the sessions.
Retrieving data
Using RGoogleAnalytics we can fetch the data
|
|
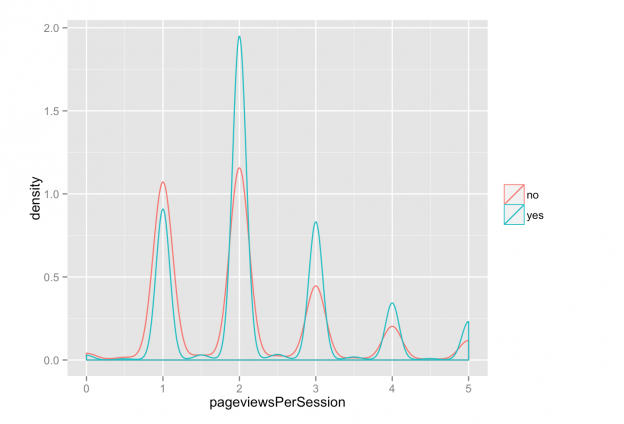
Now we have the data to compute the density for both versions (encoded in dimension1) because we’ve got the value for pageviewsPerSession for each session.
So doing some aggregating and plotting we get something like this: