Update of SARS-CoV-2 Shiny App
I’ve updated my Shiny-App.
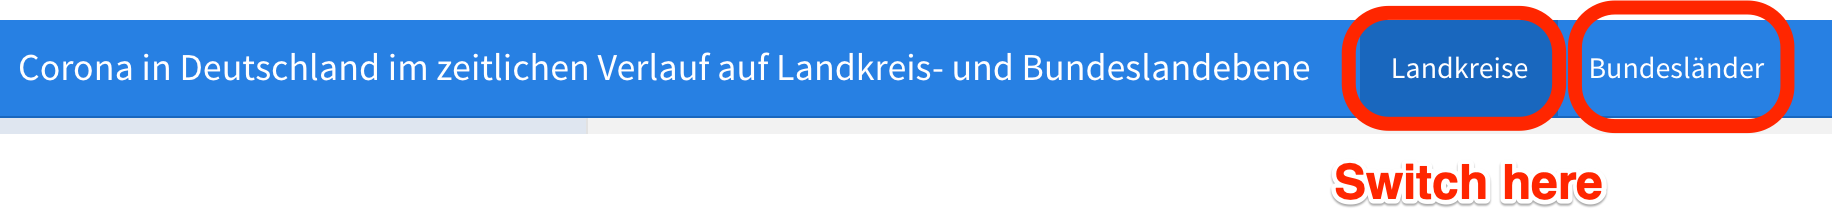
Now you can switch between Bundesländer and Landkreise:
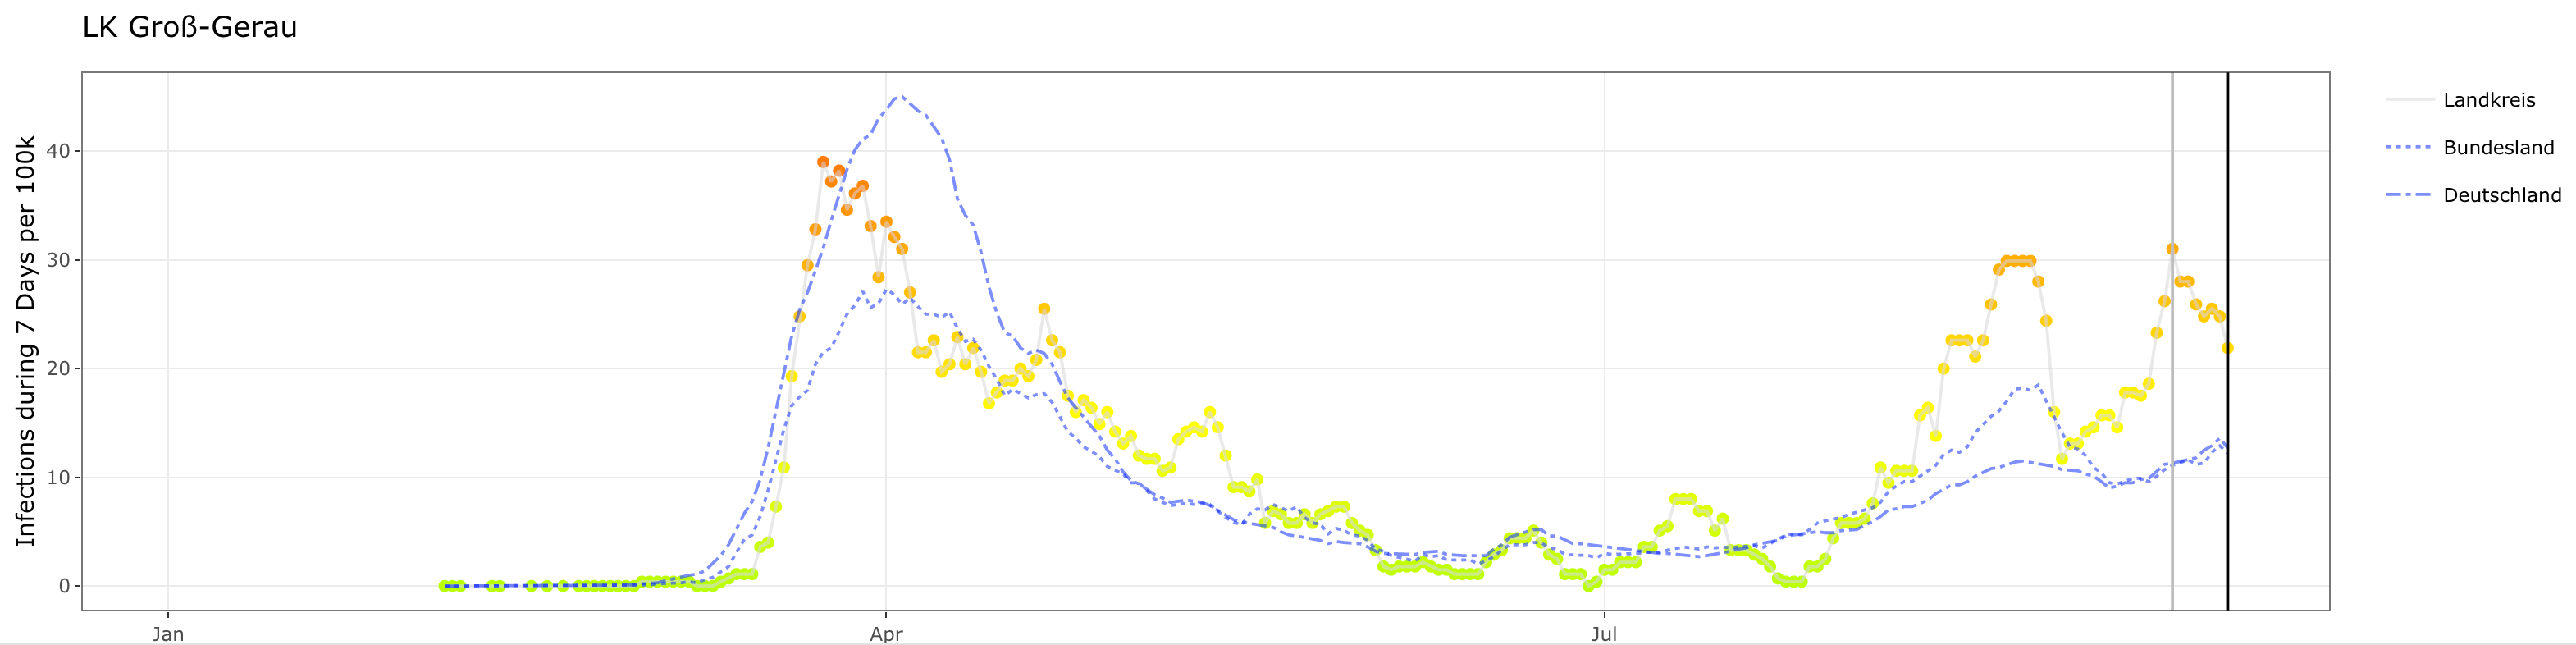
The lineplot showing the development of Covid-19 infections per day contains one or two additional lines for comparison: The value of the chosen Bundesland and for whole Germany:
For more information about the shiny app please read here.