Simple Prediction in SARS-CoV-2 Shiny App
I made another small update to my SARS-CoV-2 Shiny App.
As the discussion in Germany about whether to open schools and shops starts again I was wondering how I could visualize a simple prediction of future infections.
So I did the following simple approach:
Take the lowest and highest 7-day R-value of the last 7 days. Then use these two R-values and predict the infections for the next four weeks.
The result is shown using geom_ribbon of ggplo2: (See the gray area in the
red rectangle below.)
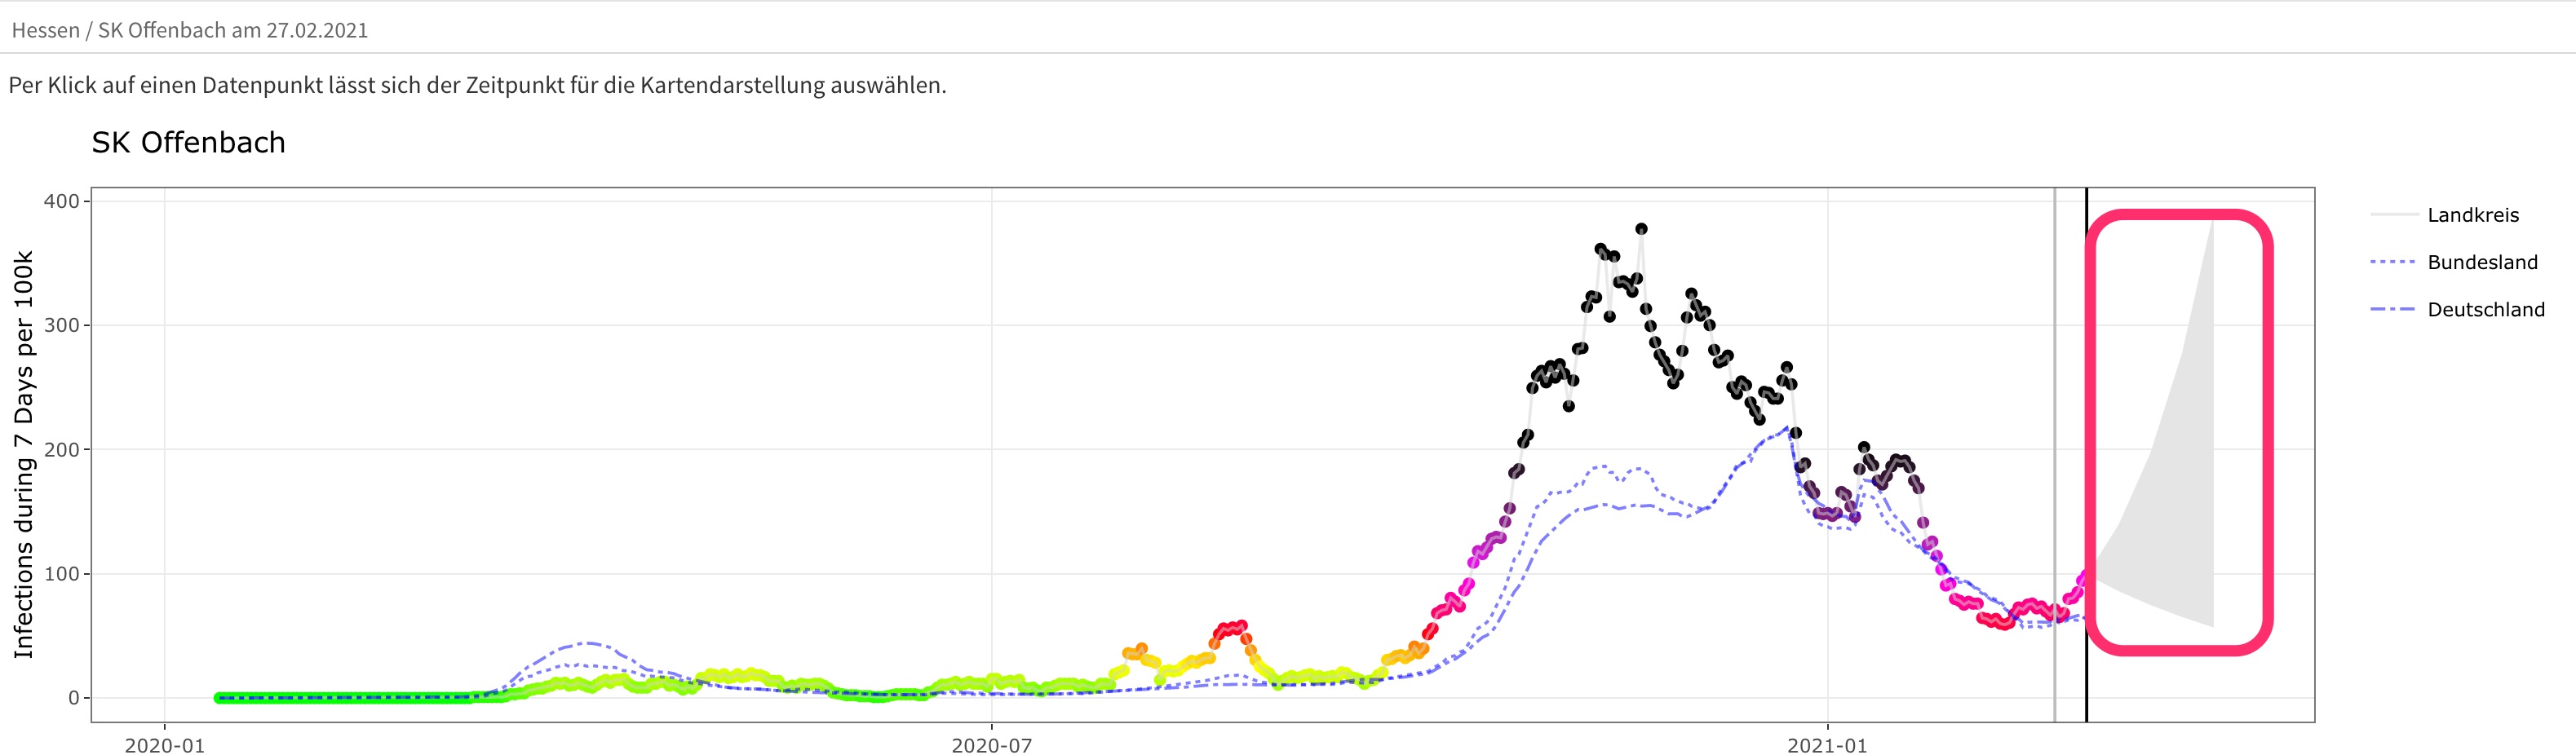
Because I use the last known date as starting point and the infections get even higher as time passes because it takes some time until all infections are known bei Robert Koch institure the prediction errs to the lower side.
Note: new tag
I’ve introduced a new tag. Use Corona-Shiny-App to get all post about my shiny app.