Custom Formats in gt Tables
The “grammar of tables” is used to build tables with the R-package gt. Thomas Mock published an extension package called gtExtras which is used all over in tweets about NFL and Fantasy Football such as win and loss history information in a table.
gt
follows a similar philosophy such as ggplot2
. On the one hand there is the data
to be shown (in a table resp. a plot). On the other hand there is the description
how to visualize the data: What is the table header, are there subheaders, how
are the cells grouped and formated?
So it was time to check out gt
. During my tryouts I came across one demand
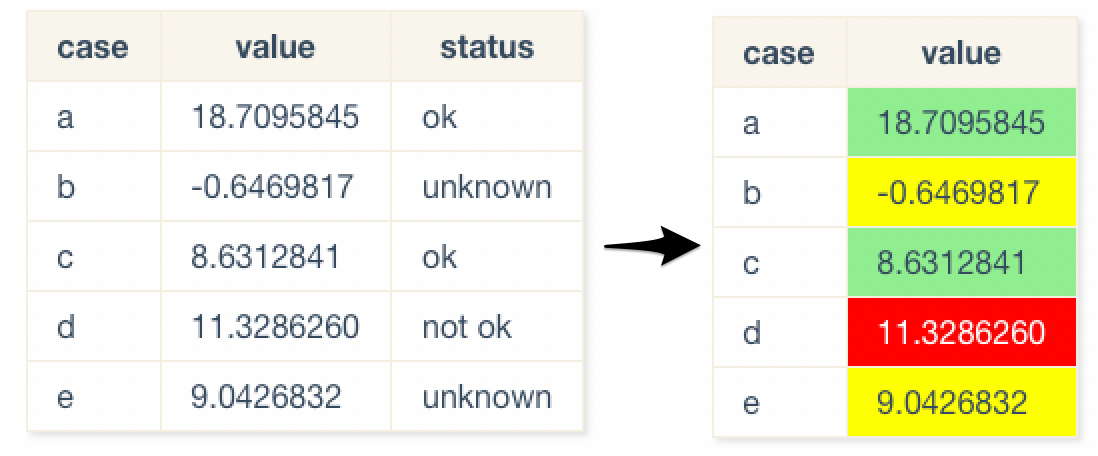
I haven’t found an in-built solution for: I wanted to format a column with respect
to the value of another column. Here’s the way I solved it: